Proof that the DSR works
If you refuse to examine the evidence, you forfeit the right to be a sceptic.

DSR top 100 vs API top 100
Australian Property Investor magazine (API), publish a "Hot 100" issue most years. They consult with industry experts to pick 100 suburbs predicted to have above average growth over the next year and beyond.
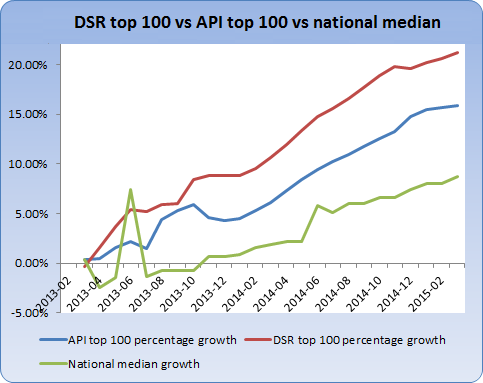
As you'll see the DSR top 100 beats the industry experts in every case. And this is on top of the industry experts beating the national average growth rate.

The comparisons
The following links show all the comparisons for each issue of the API top 100 since the birth of the DSR in 2010 to the time of writing. Each link contains an analysis of the comparison, highlighting the capital growth difference.
Method of comparison
A list of the top 100 property markets by DSR is taken from the DSR database. This is done for the same point in time that industry experts made their contributions to API.
Then the growth of both sets of suburbs is calculated at least one year after the publication. The growth of the DSR top 100 is averaged and compared to the average growth of the API top 100. The national average growth rate is thrown in as well to place performance in context.
It gets even better
The DSR and not the DSR+ was used in the comparison. The DSR+ has been proven to outperform the DSR. This makes sense given it considers a much larger data set.
Also, note that 100 property markets were selected to make the comparison similar and to provide a large sample size. However, there is no reason why investors have to review the DSR top 100 to source suitable hot spots. The DSR top ten is an even better set of hot spots which outperforms the top hundred.
Also note that no additional research was performed on the DSR top 100 to refine it. The list was simply pulled out of the DSR database ordered by DSR. Whereas the experts of the API top 100 perform careful and time-consuming research.
This opens up the opportunity for investors to achieve even better performance. An investor could take the DSR+ top 10 and refine the list further with extra research.
Are the calculations reliable?
In performing the comparisons a median-based capital growth calculation was used. The median suffers from statistical anomalies, at times exaggerating the true growth. This is more likely to happen in areas where there is heavy developer activity. See the blog on Misleading Medians for a clearer explanation.
A new two bedroom unit is always more expensive than an old two bedroom unit next door. With new property entering the market, the median shifts higher. But the extra supply actually counteracts capital growth potential. So heavy developer activity can reduce true capital growth but inflate median growth.
Heavy developer activity can be indicated by sudden increases in population, higher stock on market and increased sales volume. Population growth and sales volume increases are often referenced by some experts as signs of capital growth potential.
However, the basic DSR does not consider population growth. Read why here, "The great population growth myth". The DSR also favours low stock on market suburbs and doesn't consider rising sales volume. This means median price anomalies are less likely to exaggerate the performance of the DSR top 100.
Future analysis
Despite how impressively the DSR has performed historically against the API top 100, it is likely the future will tell a different story. More and more industry experts are turning to the DSR. So they're likely to combine the DSR data with their own research, blurring the cause of success. Already, other data providers are starting to adopt the DSR approach - using Big Data to score supply and demand.
