The great population growth myth
| Topics: | Population growth, Capital growth, Indicators, Property data |
| Author: | Jeremy Sheppard |
| Date: | April 2015 |
For decades property investors have been taught that population growth is one of the most important drivers of capital growth. Not only is population growth the most overrated indicator of capital growth, but amazingly it can be an indicator of negative capital growth.
The problem is perpetuated by many property investment advisors, educators and so-called experts. They incorrectly interpret property data, passing on their misunderstanding to investors.
This article contains:
- How the myth started
- How population growth data can be virtually useless to investors
- How population growth data can actually be dangerous to investors
- Examples when high population growth = low capital growth
- Examples when low population growth = high capital growth
- How investors can protect themselves from misinterpreting the data
- Better alternative capital growth indicators
Introduction
For decades economists and statisticians have published data apparently showing a close correlation between population growth and capital growth. Property investors have long since latched onto this in an attempt to improve their investment's future capital growth potential.
Sometimes it has worked out OK for investors. But it's more by chance than by expertise. There are many variables at play after all. And quite often it works out to be a mistake without investors even knowing why it all went pear-shaped.
The theory
The theory of population growth influencing capital growth is actually quite sound. It is based on a fundamental law of economics: supply and demand.
Assume a fixed number of properties and a growing number of people who need a property. The increased demand for a limited supply equates to price rises.
Investors want to know of locations in which demand exceeds supply because then prices will rise. But can investors use population growth data to identify locations where demand exceeds supply?
The problem
The problem comes in the practical application of population growth data. Here are the problems in a nutshell:
- The data is a lag indicator not a lead indicator
- The data is sampled too infrequently
- The publication of data is delayed
- Up to date data is inaccurate for small geographies
- Trend continuation needs to be assumed
- There is no breakdown in the nature of the data
- It is only one side of the supply to demand equation
- The data at best indicates a matching of supply to demand
- The data frequently reflects the wrong side of the supply to demand equation
Lag versus lead indicators
Population growth data published from the Australian Bureau of Statistics (ABS) is recorded and published after the event has occurred. People do not move into a suburb living on the streets waiting for property to become available. Instead, they move into an already vacant dwelling.
Diagram 1 - sequence of events
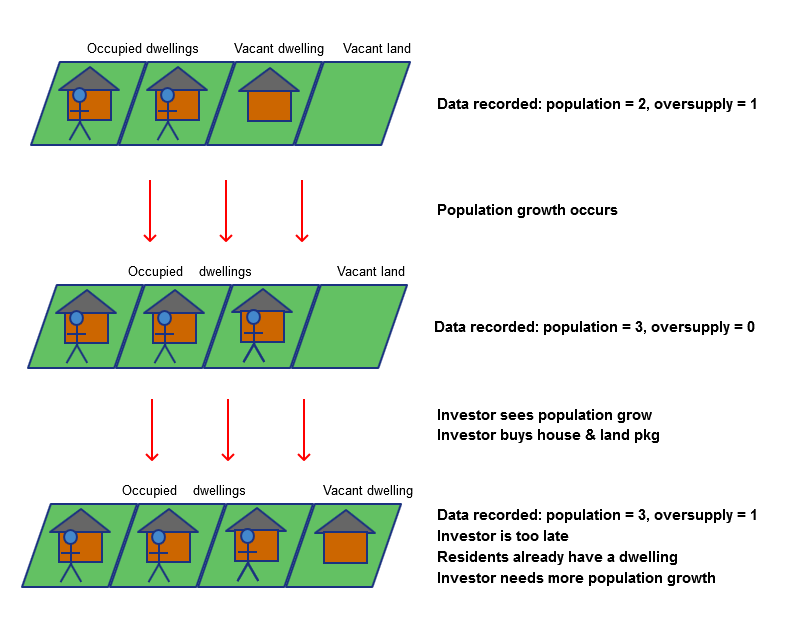
Diagram 1 shows the sequence of events for population growth data to become available:
- A new dwelling is built
- The occupant arrives
- A census is conducted
- Data is published showing the population growth
A property must be vacant for a new occupant to move in. So even if that is only for a day, there is an over-supply of property for that day until the new occupant arrives. At the time of arrival, demand is matched with supply.
Diagram 1 shows that if an investor follows the population growth data, they will be behind the eight ball. Why would existing residents want to move into the investor's property when they already have a property to live in?
Population growth data, no matter how high it is, can only at best indicate a case where supply is matched with demand. Population growth data cannot indicate a case of demand exceeding supply because the population can only grow into an already existing supply.
In fact, population growth data can actually mislead investors about the nature of supply and demand. Diagram 2 shows a high population growth market next to a low population growth market.
Diagram 2 - High vs low population growth
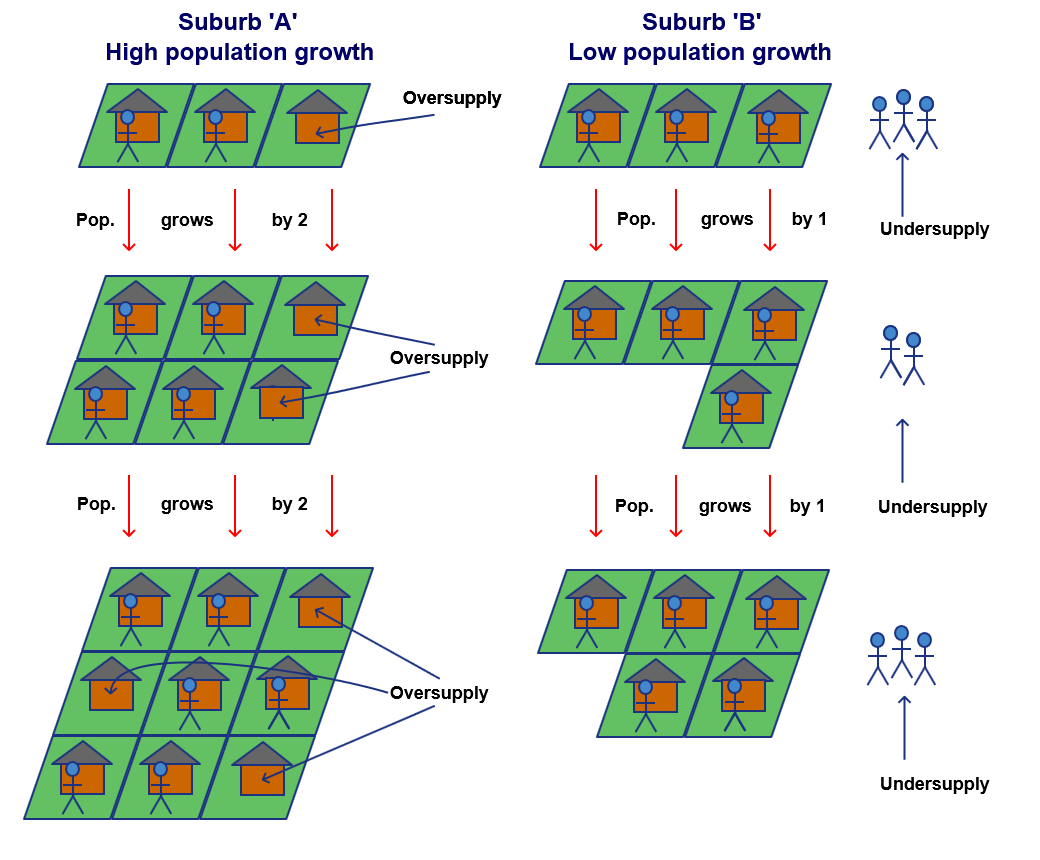
Diagram 2 compares two property markets over time. The state of each market changes as time passes from top to bottom.
The market on the left, Suburb A, has the highest population growth over the three phases of growth recorded. The population grows from 2 initially to 4 and then to 6.
Note that there is nobody waiting to enter Suburb A. There are even properties vacant. These properties are marked in the diagram as "Oversupply".
On the other hand, the market on the right, Suburb B, has people queueing up to enter it. Initially, there are 3 people in Suburb B. But there are another 3 wanting to move there. These people are marked as "Undersupply" because there is no supply to meet their demand. That's why there are no vacant dwellings in Suburb B.
Clearly, demand exceeds supply in Suburb B. But the market on the left is the one showing the highest population growth. However, it has over supply with respect to demand. So high population growth does not mean demand exceeds supply. It can in fact mean the opposite.
Also, note that the people waiting to enter Suburb B are not counted in population growth stats. Investors don't know about the people on the right by looking at population growth stats.
So population growth data on a micro level is unable to predict capital growth reliably because it can't identify locations where demand exceeds supply.
Sampling frequency
Every 5 years the ABS conducts a nationwide census surveying the Australian population. The population for the vast majority of Australian suburbs can be estimated as a result. Comparing the change in population since the last survey, we can estimate the population growth.
However, 5 years is far too infrequent a sampling rate. And at the time of writing the ABS has not confirmed if a census will even be conducted in 2016. The last one was in 2011.
Given that population growth data is a lag indicator, we can only use the data to try and establish a trend and then assume that trend will at least continue.
Chart 1 - Population from census data
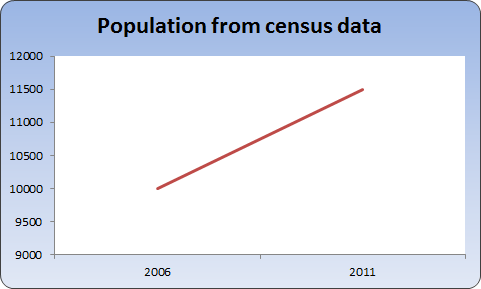
The chart showing population from census data (Chart 1) has only two values:
- A population of 10,000 in 2006 on census night
- A population of 11,500 in 2011 on census night
From this we can see what appears to be a clear growth trend. By only having one sample of population figures every 5 years, we can't possibly assume an accurate trend. Our assumptions could be hopelessly wrong as the following chart shows.
Chart 2 - Real population
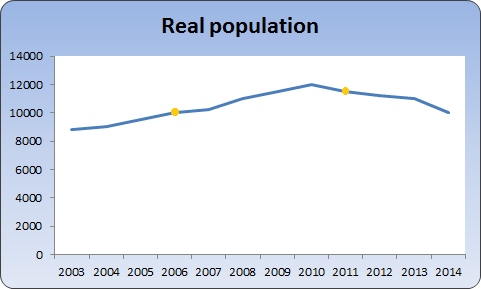
Chart 2 has the exact same figures as Chart 1 for the population on census night at 2006 and 2011:
- A population of 10,000 in 2006 on census night
- A population of 11,500 in 2011 on census night
Chart 2 is the same property market as Chart 1 but Chart2 shows more data points. These may be true data points of the population, but this data is not available. The data is either not recorded or not published at these points in time.
Looking at Chart 1 an investor would make a decision to buy in this location on the assumption that the strong "trend" will continue.
Chart 3 overlays the two population growth curves so you can see what is really happening. Just to be clear, chart 1 and chart 2 are combined with values unchanged in chart 3.
Chart 3 - Census data vs real population
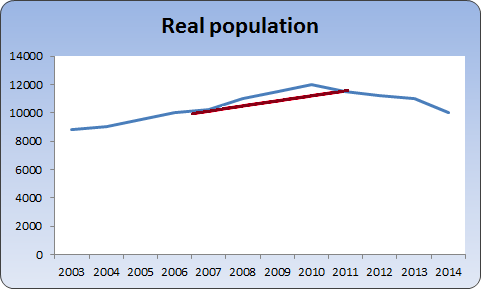
Imagine looking at census data in 2012. That's the red line in chart 3. An investor could easily decide to invest in this location not knowing the true population (blue line) is actually declining.
ERP
There is an alternative figure to the census data published by the ABS. It's called the "Estimated Resident Population" or ERP. This is sampled and published much more frequently. However, it has its own problems as I'll explain soon.
Delayed population publications
Just another point about the timing of population data from a census: the results are published almost a year after the survey was conducted. The data is at best 1 year old when we first get our hands on it and at worst 6 years out of date just prior to another census publication.
The next census is due in mid-2016 but the ABS has not confirmed yet if a census will even be conducted. Even if they do, we may not have suburb-level population figures available until 2017.
Up to date data is inaccurate for small geographies
A more frequently sampled and published statistic from the ABS is the ERP - Estimated Resident Population. This is a combination of census data and local council data. It is published quarterly.
The problem with this data is that it is calculated for the Local Government Area (LGA). An LGA can contain one or more post codes. A post code can in turn contain more than one suburb. This hierarchy is visualised in diagram 3.
Diagram 3 - LGAs, postcode & suburbs
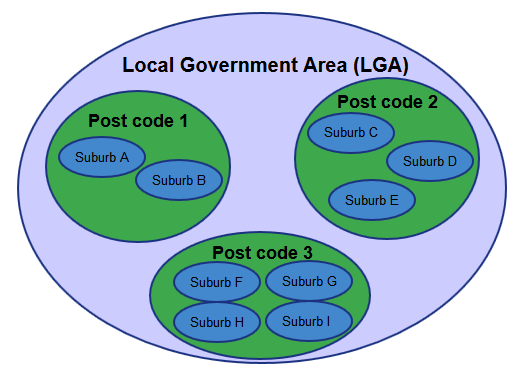
The local government areas of Toowoomba and Brisbane have over 200 suburbs each. Post code 2460 in NSW has over 80 suburbs. This is in the Clarence Valley LGA. The QLD post code 4570 also has over 80 different suburbs and stretches across the LGAs of Fraser Coast and Gympie.
Having data at the LGA level is far too inaccurate geographically. It is highly unlikely the population growth in an LGA will be evenly distributed among all the suburbs. Investors can't be asked to guess which suburb to buy in.
Let's say suburbs B, C and F in diagram 3 had their population growing at a whopping 10% per year, but all the other suburbs were growing at only 1% per year. The average growth rate for the LGA would be unimpressive. This would not show up on an investor's radar. So the opportunity would be missed.
Now let's say suburbs A, B, D, G & I all had population growth of 15% and the rest had only reasonable growth of say 3% per year. The average LGA growth would be very high, perhaps as high as 9%. But an investor wouldn't know which suburb to buy in. What if they picked C or F, one of the 3% population growth suburbs?
Trends don't last forever
Even if we could overcome issues of delayed data or inaccuracies in pinpointing the locations of high population growth, we still have an issue with the trend.
Population growth is a lag indicator. This means we can't capitalise on the event prior to it occurring. So we need to assume that the high population growth will continue. However, trends don't last forever.
The longer the trend, the surer we can be that it is about to end.
The odds of tossing a coin 'heads up' 10 times in a row are 1024 to one. The odds of 11 in a row are 2048 to one. The odds of 12 in a row are 4096 to one. The longer the sequence (trend), the more unlikely it is.
Population growth data infrequently sampled doesn't give us a trend. But even if it did, it still doesn't tell us the trend will continue. And investors need to assume a trend with population growth will continue if they're to capitalise on that data because it's a lag indicator.
No data breakdown
In order to calculate a change in population we need to know:
- Population at the start of the period
- How many people moved in during the period
- How many people moved out during the period
- How many people died during the period
- How many people were born during the period
Babies don't buy houses. They may place pressure on the nature of dwellings in demand. But if births are the predominant cause of population growth, there will not be much pressure on prices in general. Without a breakdown in the cause of population growth, investors are buying blind.
Imagine a suburb dominated by young couples living in apartments. A great many of them decide to start a family. As they do, the population growth increases because of all the new births.
But "apartment city" is no place to raise a family, so they start to look for houses. Unfortunately, this means moving into a different suburb.
An investor who received information about the population increase would think they're on a winner buying in this location. But they would be disappointed to later discover all those young families vacating to premises more suitable for a growing family.
Not knowing the breakdown in the cause of population growth, the investor can be misled.
One side of the supply and demand equation
Population growth only represents one side of the supply-demand equation. Capital growth occurs when demand exceeds supply. If demand is high but supply is high too, then capital growth may not occur.
Which side of the supply to demand equation do you think population growth represents?
Virtually every property investment educator or advisor would say it represents demand. For every new person in our population, there is a new requirement for accommodation. That surely equals demand.
True, but for every person able to move in, there had to be a supply of vacant accommodation. If there was no supply, there could be no population growth.
If the vacancy rate remains steady, how can the population for a suburb increase? The major way is for new dwellings to be built. New dwellings means there is more supply. Supply is the enemy of capital growth. So in this case, population growth could actually be an indicator of increasing supply rather than demand.
So how did we all get fooled?
Nobody was trying to mislead us. It all happened as a result of misinterpreting the data. Capital growth has for a long time been calculated using changes in median values over time. The median however is subject to anomalies. These anomalies are typically exaggerated in locations where there has been high population growth.
Picture a suburb in which a new estate is opened adding an extra 100 houses to the suburb. Obviously when those houses are occupied there will be a rise in population.
The same suburb would probably have an increase in median values. This is simply because new houses are typically more expensive than old ones. With more sales being amongst the new properties, the median is calculated as a higher value.
See the Misleading medians blog for a detailed explanation.
The extra supply of housing may have actually dampened capital growth. But the records indicate there was "median" growth because new is usually more expensive than old. But the statisticians never termed it "median growth", they called it "capital growth".
We end up with a situation in which there is strong population growth and increased median values. You can see how easy it is for statisticians to draw the conclusion that population growth results in capital growth. The problem has always been how capital growth is calculated.
Those locations with the most rapid population growth are likely to be those locations that had the most intensive amount of developer activity. These may be the very locations investors should steer clear of due to oversupply.
Gladstone example
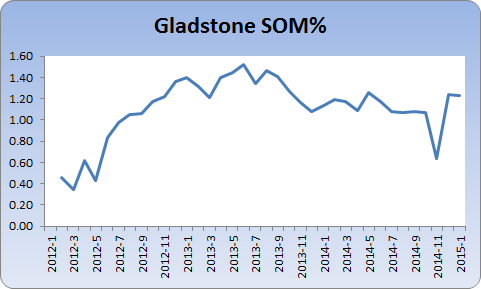
Because of all the news about multi-billion dollar infrastructure projects in Gladstone around the time of the resources boom, property developers thought they couldn't lose. Like so many others before them, they ignored the supply side of the equation and built and kept on building until there was chronic over-supply.
Chart 4 shows the sudden rise in percentage Stock On Market (SOM%) over 2012.
Chart 4 - Gladstone SOM%
By 2013 the oversupply of property in Gladstone started to affect vacancy rates. Chart 5 shows the virtual explosion in vacancy rates.
Chart 5 - Gladstone Vacancy
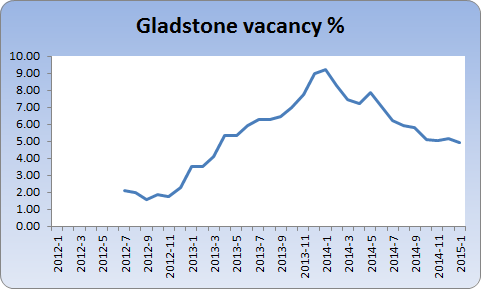
The overall demand to supply ratio dropped of course as a result of the oversupply. This can clearly be seen in Chart 6.
Chart 6 - Gladstone Demand to Supply Ratio
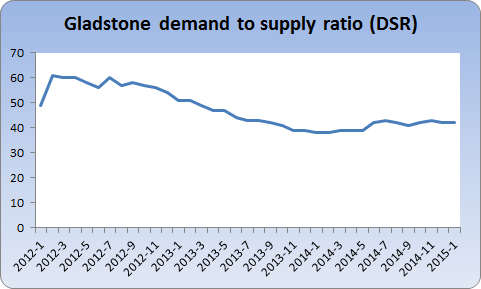
From charts 4, 5 & 6 we should expect to see a drop in prices for property in Gladstone. However, chart 7 shows the median based typical values in Gladstone didn't really dive until 2014 when finally developers were well and truly aware of the oversupply problem.
Chart 7 - Gladstone typical median values
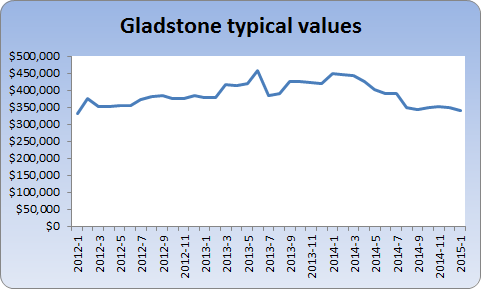
Medians didn't fall over 2012 and 2013 because new properties are more expensive than old. Developers don't build old properties. So the more popular properties selling were the newer ones.
Gladstone had every reason to experience negative capital growth. And it did, along with reduced rents. However, the medians actually grew right up until early 2014.
This "growth" is the effect of heavy developer activity. It causes fake price growth to appear in the median. Investors can't leverage equity from medians, they need genuine capital growth.
Population growth forecasts
Another misinterpretation of population growth data is that of forecasts. We've all read something along the lines of...
"The population for the region is expected to nearly double in the next 15 years"
These sorts of forecasts are based on what government and developers will supply, not what people necessarily demand. But these forecasts are interpreted as demand indicators.
I asked Lailani Burra of Id.com.au the population experts how some of the population forecasts are determined.
"Firstly, it depends on the purpose the report covers. The Australian Bureau of Statistics will usually publish country-wide forecasts and so concern themselves mostly with immigration, births and deaths".
"State government forecasts consider inter-state migration and also may take a closer look at the impact of some major state projects".
"Forecasts we do for local councils delve into much finer detail such as individual developments or new estates".
Burra says the key factors affecting population growth forecasts are, "Availability of land and new housing developments. Given the number of new dwellings to be supplied to an area, the population growth can then be forecast".
And there's the key point, "The number of new dwellings is an input to a population forecast, not an output" she says.
Did you get that? Investors read these forecasts and start picturing a queue of people waiting for houses to become available. It is the other way around. Houses are supplied and then if the demand matches that supply, the population grows as forecasted.
Burra does point out that big-time developers will research supply and demand to determine where to build these new estates. So it is unlikely a well-researched developer will build in a market for which there is insufficient demand.
However, where developers do choose to build will certainly spoil returns for investors who were soaking up all that demand on their own.
Capital growth occurs without population growth
There are examples of strong capital growth occurring with little or even no population growth. If population growth was such an important driver of capital growth, the following scenarios would not be possible.
Restrictive council example
Imagine a council deciding they've had enough in-fill for a while. They decide that if you knock down a house, you can only build another house - not a duplex. There will be no more apartment complexes and townhouses. "It's dense enough already" they say. This policy might easily be applied in CBD fringe or inner city council zones for example.
Without new dwellings or densification, it is not possible for strong population growth to occur. In fact, there are only two ways it can happen:
- Decrease in vacancy rates
- Increase in people per household
For a very long time now, the average number of people per household has been decreasing. So we can virtually rule out option 2 from having any influence. If anything, the population would decrease as the number of people per household decreases.
Let's say the vacancy rate is 3% which is typical. And let's assume 33% of all properties are landlord owned which is also typical. In that case, the maximum population growth that can occur via vacancy rates reducing (option 1) is a measly 1%. That's 33% of 3%.
If the council were to hold by their decision for the next ten years or even twenty, it is likely the population growth would actually be marginally negative. This is because of the slight reduction in people per household which overwhelms the tiny 1% increase in population by vacancy rate reduction.
Now do you really believe that for 10 or even 20 years there would be virtually zero capital growth for such a property market simply because there is negative population growth?
On the contrary, those people looking for less dense accommodation may consider this council area an oasis in an ever increasing apartment city. The increased desirability of the location may accelerate capital growth.
So what we could see is 1% population growth and 100% capital growth. Those two figures are far too different to say that population growth and capital growth go hand-in-glove.
This is a clear example where both forecast and actual population growth data on a micro level gives the complete reverse indication of the potential for capital growth to what investors have traditionally assumed.
Chart 8 shows the change in population for the Sutherland Shire in Sydney recently. You can see that there is virtually no growth occurring at all. These figures are the estimated resident population from the Australian Bureau of Statistics. The average growth rate was about 0.5% per year.
Chart 8 - Sutherland LGA population changes
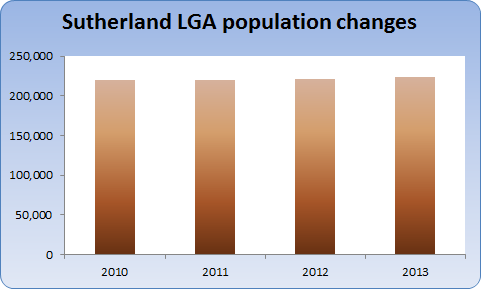
Source: abs.gov.au
Despite the static population in Sutherland, price changes have been dynamic. Chart 9 shows there has been some capital growth and then a slight fall in prices and then capital growth again.
Chart 9 - Sutherland LGA prices changes
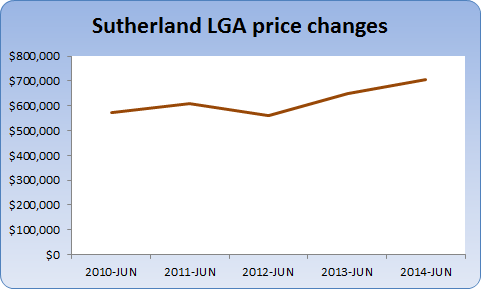
Capital growth takes place despite almost no population growth at all.
New estate halted example
Another example where population growth and capital growth do not walk arm in arm is that of a new estates on the outskirts of a major city.
Picture a sparsely populated relatively rural area about to become the most recent victim of urban sprawl. This area may consist of very large blocks of mostly farmland.
A developer buys up the land from farmers in anticipation of future council rezoning. The developer is land banking the entire area waiting for the opportunity to create a new housing estate.
Now imagine the development plans are delayed, perhaps by council not rezoning for a long time; perhaps from complaints by local land owners holding up progress; perhaps by developer finance problems; perhaps from tardiness by council in providing the infrastructure.
Let's say these delays dragged on for 10 years. During that period the value of the land may have increased as a natural result of limited supply and increased demand for new housing. In fact, it is possible for a doubling in price to occur.
Yet the population of that land hasn't budged. It is still farmland remember. We don't count possums. Here we have a case of 0% population growth and possibly 100% capital growth over a ten year period.
This is another example where on a micro level the population growth data for a suburb betrays the potential for capital growth.
When does population growth work?
Population growth does influence capital growth in some cases. The most notable scenarios are:
- When the data is for an isolated regional town
- When the data is at a macro level e.g. Australia-wide
- When a crowd draws a crowd
Diversified economies vs isolated towns
Parramatta is not an isolated regional town. Instead, it is fast becoming an alternative CBD for Sydney. Numerous property investment commentators therefore argue the case for above average capital growth for Parramatta. That may be true for commercial office space, but pressure on residential property prices is governed by a need to live there, not work there.
Parramatta has trains arriving every few minutes in peak hour. The bus terminal is one of the largest in Sydney and transports commuters to and from many distant parts of Sydney. The M4 also runs right past Parramatta.
There are people who work in Parramatta that live in the Sutherland Shire, the Northern Beaches, the Blue Mountains, even as far as the central coast. Parramatta's businesses can draw on such a massive pool of non-residents that a moderate increase in job opportunities will not significantly impact housing.
Job density for an area with good transport nodes and a broad reach of external residents does not immediately affect prices in the town itself. It does however have some impact.
There will always be those who couldn't be bothered battling traffic and would rather move closer to work. If some of those commuters actually move to the same suburb in which they work, then yes, the increased jobs will affect prices.
Isolated regional towns do not have a massive pool of workers to draw in from surrounding suburbs. Obtaining employment in isolated towns often necessitates moving there. For this reason a rise in population in an isolated town is more likely to be an indicator of capital growth potential than in locations that have many neighbours.
But even in this situation a better indicator is reducing vacancy rates rather than increasing population. Vacancy rates are more sensitive to a rise in demand if supply is limited.
Map 1 - Where is Port Hedland
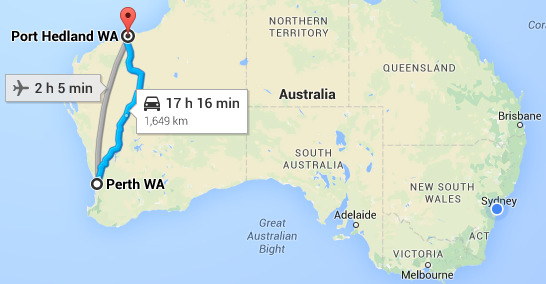
Source: Google.com.au
Map 1 shows the mining town of Port Hedland and the travel time from Perth. It is almost the same distance from Melbourne to Brisbane. Port Hedland is isolated. In order to work there, you need to live there.
Chart 10 shows the rise in population for a small period of time in Port Hedland due to the mining boom. The change in population from 2009 to 2010 was over 18%. This is more than 10 times the growth rate of Australia as a whole over the same year.
Chart 10 - Port Hedland population growth
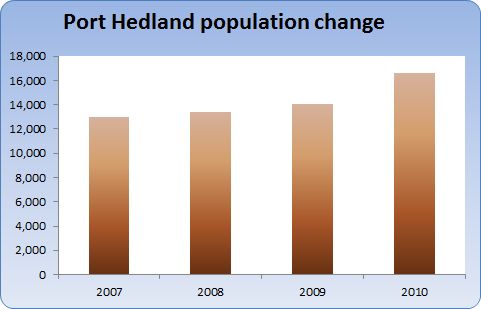
Source: Western Australian Planning Commission
We all know the massive rise in prices in Port Hedland due to the resources boom. House prices according to Core Logic RP data rose to $1.2mil in mid-2011. The growth rate for the last 10 years according to RP data has been over 13% per annum.
Macro level data
Population growth at a macro level such as city, state or country often shows a clearer correlation between population growth and capital growth. This is a similar situation to an isolated regional town.
Very few people live in Sydney and work in Melbourne or live in WA and work in SA or live in Australia and work in New Zealand. Jobs at a macro level require dwelling in the same macro level.
The big data providers such as Core Logic (RP Data) and Australian Property Monitors provide data at a macro level to businesses and governments that operate at a macro level. The big banks for example conduct their business country wide. They're interested in macro data.
But investors can't buy Australia. They can't buy Victoria. They can't buy Brisbane. Investors can only buy one house in one street of one suburb of one post code of one LGA of one statistical division of one region of one city of one state in Australia.
The macro data is so far removed from the data investors need to know, that it is virtually useless. Investors need to know the capital growth prospects for micro markets. They need data at the micro level.
This article has highlighted how at the micro level, population growth data can be virtually useless and in some cases dangerous. But the big data providers will continue to show how population growth does impact capital growth - at macro level. It's not relevant for investors, it's relevant for banks.
A crowd draws a crowd
After the 1st wave of population growth, there may be a large number of people in need of secondary services such as nearby shops, schools, entertainment and so on. Tradesmen, accountants, dentists, lawyers, shop owners - may recognise an opportunity to service an area that has experienced recent population growth and is undersupplied currently with these services.
The secondary services bring with them the potential for secondary jobs. Assuming the employees move to the area, they place pressure on local housing.
It can take a long time for the impact of the secondary wave of population growth to affect prices. Investors using the 1st wave as an indicator of the 2nd wave are taking a risk. They must firstly establish that the area is undersupplied in these 2nd wave services. And secondly, investors must know that the provision of such services will indeed impact housing demand.
But again, a more accurate indicator in this case is decreasing vacancy rates.
Solution
There are better capital growth indicators than population growth that don't suffer from the issues I've described earlier. Vacancy rates for example are a vastly superior indicator than population growth.
Vacancy rates don't suffer from issues with geographical inaccuracy; low sampling rate; or unknown data breakdown. A very low vacancy rate is an indicator of imbalance. The balancing act is for either rents or dwelling supply to increase. If supply is limited, then there is only one option.
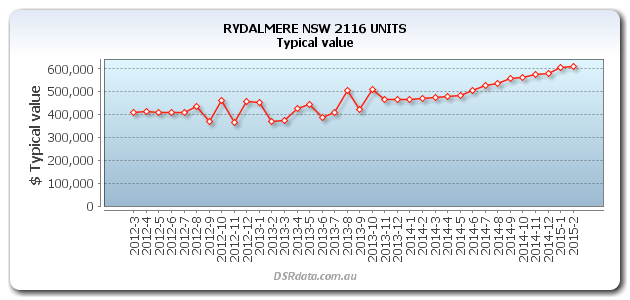
Demand for unit accommodation in Rydalmere NSW, post code 2116 was quite high in February 2013. The vacancy rate had dropped to 0.44%. Due to the market being thinly traded there was some volatility in the figures. But for the 6 months prior, the vacancy rate had not gone above 1%. As a result yields went up and soon prices rose too.
Chart 11 - Rydalmere typical values
However, vacancy rates do have their own problems. The calculations are based on a number of base data sources:
- Proportion of dwellings owned by landlords as opposed to owner-occupied
- Number of dwellings in the location
- Number of properties currently listed for rent that are unoccupied
Any of these may have anomalies skewing the final calculation.
No statistic is immune to anomalies. The best approach investors can take is to look at a property market from as many different angles as possible by examining a truly large set of statistics. Investors should have at least half a dozen positive statistics for a property market to warrant further research.
Once more than a dozen different positive indicators have been identified, you can be pretty confident the suburb is a safe one. However, every one of those indicators should address the balance between supply and demand to have any real use.
The best single indicator of supply and demand is the DSR+. At the time of writing it considers 17 different statistics. That's more suburb data than many experienced investors would research manually.
The DSR and DSR+ have been proven to identify high growth subrubs. And this is even considering the anomalies of capital growth calculations based on medians.
Summary
Population growth data can be an indicator of future capital growth in some circumstances. However, there are many cases when the data is virtually useless to property investors. And there are some cases where the data is downright misleading.
Rather than try to discern one case from another, you should use more effective statistics. And ignore commentary/advice from self-professed capital growth experts who know little more than you do - and even less now you've read this.
From here: