How to find the best suburbs for your criteria - Market Matcher
Intro
Hi Jeremy Sheppard here for DSRdata.com.au.
You've probably already seen the Market Matcher. It helps you filter through thousands of suburbs in seconds to weed out all the rubbish and reveal the gems.
In this tutorial I go through a popular search that many investors use the Market Matcher for. You can familiarise yourself with how the Market Matcher actually works here:
About the DSR
Before we go further with the Market Matcher, you need to know something about the Demand to Supply Ratio (DSR). The DSR and the DSR+ are two of the most valuable indicators of capital growth available. They are the heart and soul of DSRdata.com.au. They predict capital growth and score its potential. The DSR really does work. If you're sceptical, you have toread this:
But if the DSR is so hot, then why do we need the Market Matcher? Why don't we all invest in the top DSR location?
Why use the Market Matcher?
Not every investor wants to buy in the very best market by DSR. There can be a number of reasons:
- Budget
- The best markets might have property worth over $450,000. That's no good for an investor limited to under $350,000. (I had one client with a limit of $130,000!)
- Proximity
- Many investors are still uncomfortable investing in areas they can't easily visit
- Investors planning a DIY renovation will need a location close to where they live
- Strategy
- The best markets for capital growth may not be the best markets for:
- Reno flips
- Positive cash-flow. Some investors will need to find a positively geared property if their ability to service the next loan is tight. The best capital growth locations may not have positive cash-flow opportunities.
- Another consideration is low risk. Sometimes high growth locations can have a higher element of risk-even in the middle of capital cities.
- The best markets for capital growth may not be the best markets for:
- Competition
- Buying into a market in which demand exceeds supply is not easy - there are many other buyers to compete with. Although I'd recommend persevering, if it really is all too much, then you can alter your criteria to pick a warm spot rather than a hot spot.
These reasons are why we have the Market Matcher.
The combination of a good understanding of data and intelligent use of the Market Matcher puts investors in a powerful position. It can remove significant risk and improve return.
I honestly believe the Market Matcher with the DSR can uncover markets that outperform some of the best picks of well-known industry experts. And there is ample proof.
In five minutes of using the Market Matcher, an investor can literally filter out more than 99% of the worst property markets in Australia. What's left behind is a list you can research further for icing on the cake.
You can read all about how to use the Market Matcher here...
Once you’re familiar with how to use the Market Matcher, we can then talk tactics and go through some of the more common scenarios for why you would want to use it.
How to find the best capital growth markets
I'm about to use the Market Matcher to find the best property markets in Australia for capital growth. However, I'm going to restrict:
- My budget to under $450,000
- I want a yield above 5%
- I also want the suburb to be within the Sydney metropolitan area
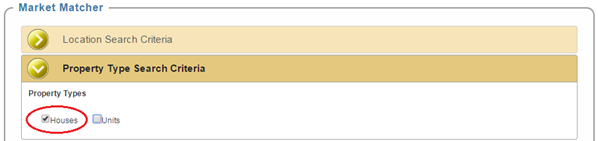
- And I'm looking for a house rather than a unit
The 1st thing I do is set the location criteria to Sydney...
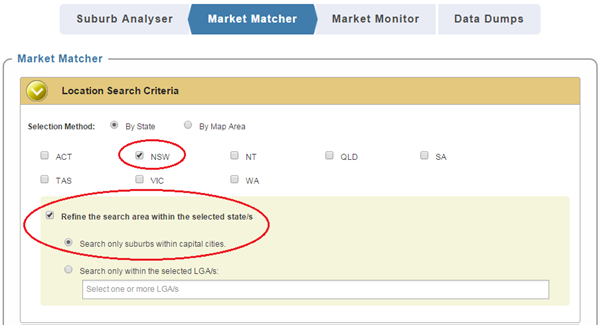
That's the easy way of doing it. Another way is to use the map. Using the map you can spread out a circle or a rectangle over the map to cover whatever area of Australia you want. Check out this link to see how to use the map...
How do I select an area using the map in the Market Matcher?
OK, so we've selected Sydney. Next thing to do is choose the type of property.
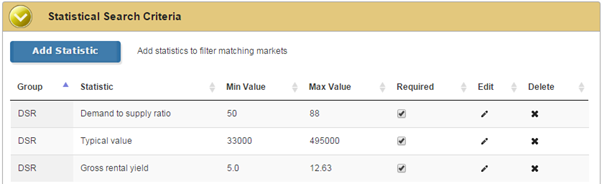
Now for the tricky part, specifying the statistical criteria. The Market Matcher gives you some default criteria for the statistics to get you started. This is what it looks like when you first go to the Statistical Search Criteria...
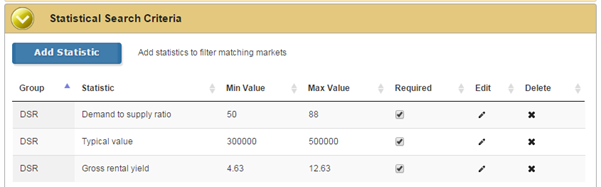
We will need to change these default settings to suit our specific criteria. Let's start with the Typical Value.
Although a suburb may have a median of $500,000 there could be properties selling for less than that. So I usually add another 10-20% to the budget. At 10% that would set the maximum typical value to $495,000 in our case.
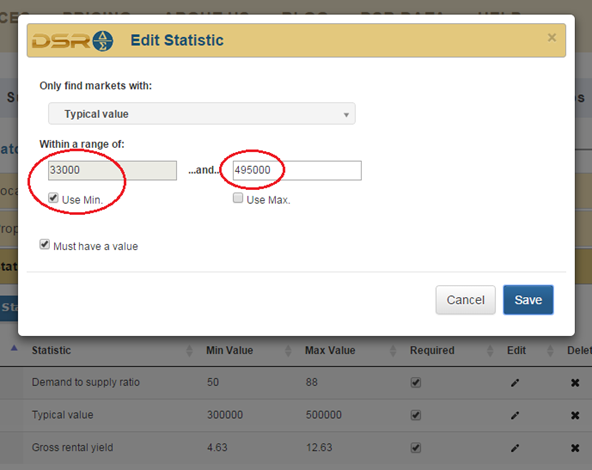
Find the row with the statistic called 'Typical value'. Go to the far right and find the 'Edit' column. Click on the pencil icon in the Edit column for the Typical Value row. A dialogue will pop up.
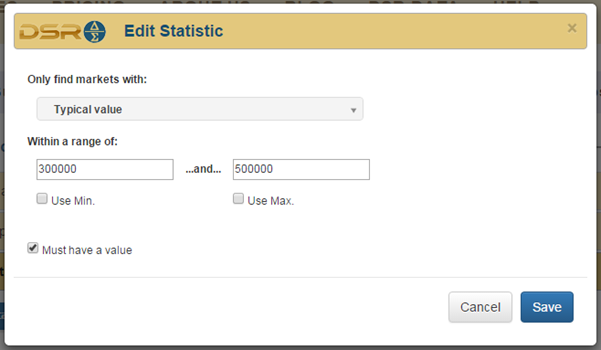
Again there are defaults we need to change. Set the maximum to $495,000. Also, we won't reject a property with good stats if it is less than $300,000 which is the default minimum. So click on the 'Use Min.' check box. It will default to the minimum typical value for any property market Australia wide. In this case it was $33,000.
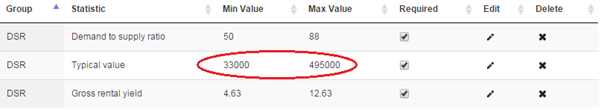
Click Save and you'll see your settings appear in the Typical value row of the table.
Now we need to modify the Gross rental yield so we only find markets with a yield above 5%. Even though a market with a yield of 4.5% may have individual properties with a yield of 5%, I want to start at 5% and find something even better.
Click on the pencil icon in the Gross rental yield row. It's under the 'Edit' column. In the pop-up set the lower limit of yield to 5.0.
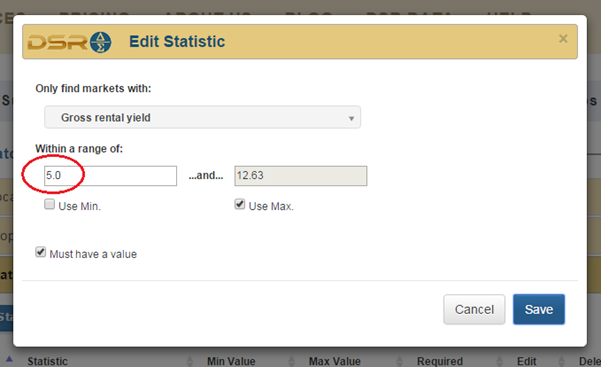
You'll notice that the top yielding market for the country was 12.63%.
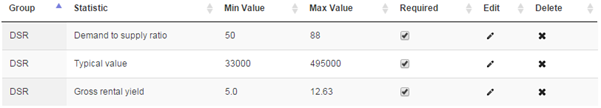
Saving this setting updates our table of statistical criteria.
OK we have our statistical criteria in place. So if we were to search now, we'd only find property markets matching these criteria. But we want those markets with the best demand to supply ratio. So we have to order the results. Click on the 'Display and sorting criteria' tab.
This tab has some default sorting already for us.
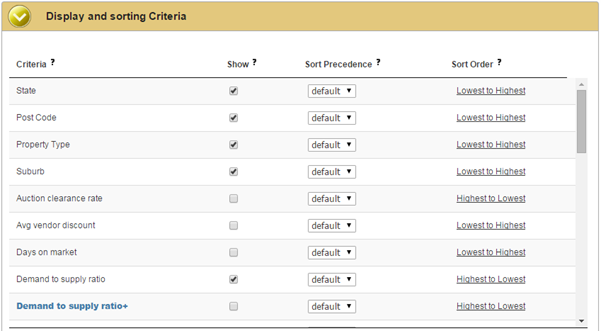
The default display and sort criteria will show the state, post code, suburb and property type. It will also show the DSR which was one of our criteria. These all have a tick in the 'Show' column.
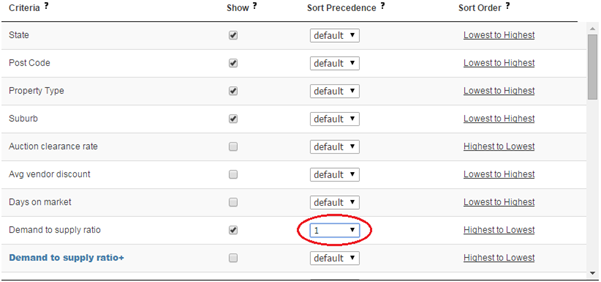
We want to search for markets where the DSR is highest. So let's sort the results using the 'Sort precedence' column so we see the best first. Change the 'default' setting to '1' for the DSR.
If you scroll down, you'll see more statistics. The statistics in bold blue are only available to privileged members. You can ignore these if your membership doesn't include them.
Scroll to the bottom and you'll see the following extra statistics have been selected to be displayed.
- Typical value
- Vacancy rate
- Gross rental yield
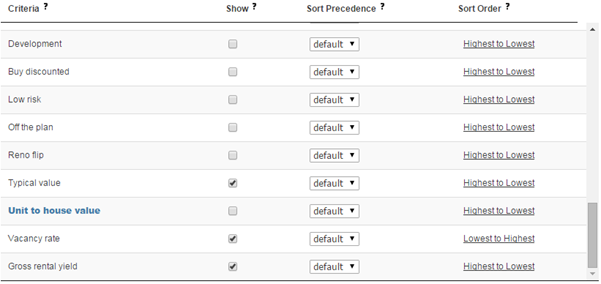
The vacancy rate was not in our criteria. But we'll have a look at it anyway. So leave the tick in the Show column for Vacancy rate.
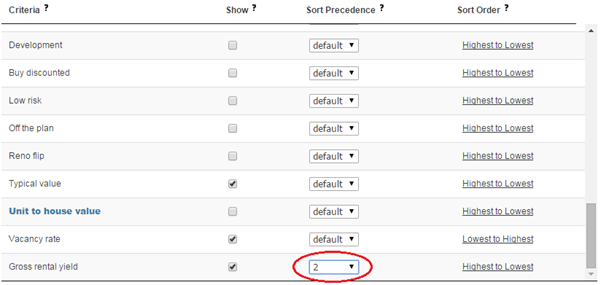
We're interested in yield as a secondary interest after DSR. So if two property markets have the same DSR, we would prefer the market with the higher yield. We're already ordering firstly by DSR. We want to secondly order by yield. So change the 'default' setting for Gross rental yield to '2'.
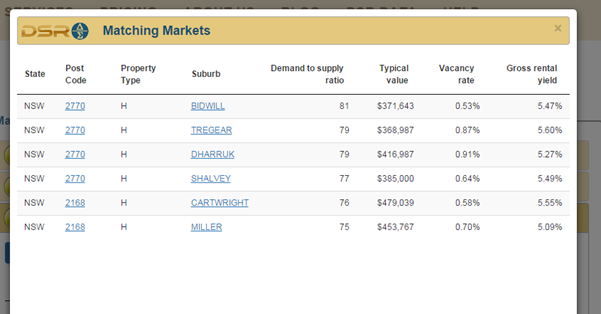
We're all set to perform our search of the DSR database for current property markets matching these criteria. So hit the big blue 'Show Matching Markets' button. The database whirs away for a few seconds and then...
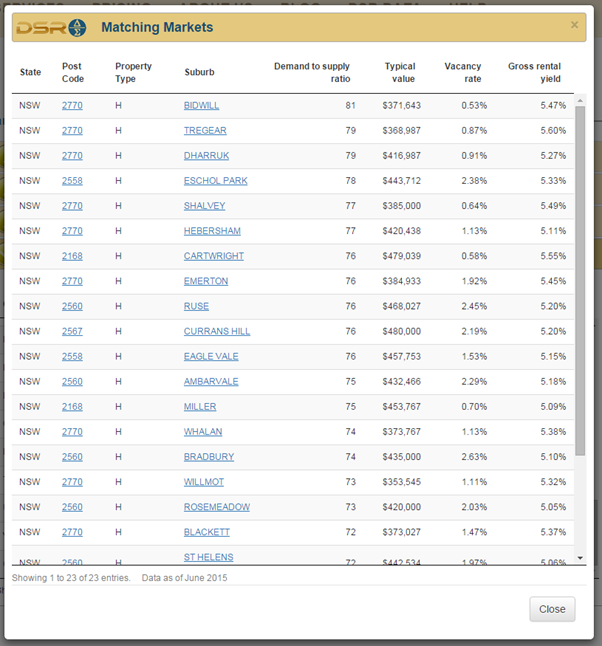
Note that all the matches we found are in Sydney, are housing markets, have typical values within our price range and a yield above 5%. What's more they are ordered from top to bottom by DSR firstly and then where two or more markets have the same DSR, they are secondly ordered by yield.
For example, both Tregear and Dharruk have a DSR of 79. But since Tregear has a yield of 5.60% and Dharruk a yield of 5.27%, Tregear is listed first.
If 2 sort preferences still don't order your results, you can specify more.
You'll notice that some of the property markets have a vacancy rate above 2%. Although none are above 3%, we want the absolute best and we can improve our list by further filtering by vacancy rate.
Close the Matching Markets pop-up window. Go back to the Statistical Search Criteria tab.
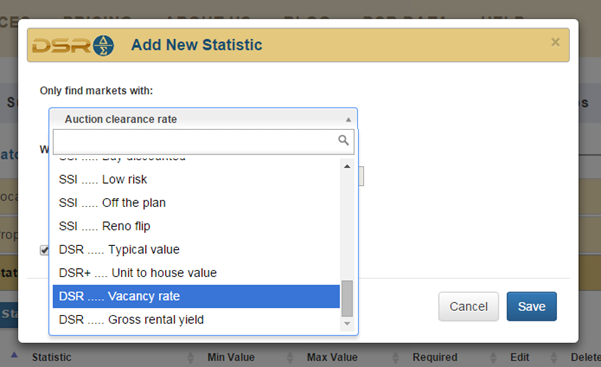
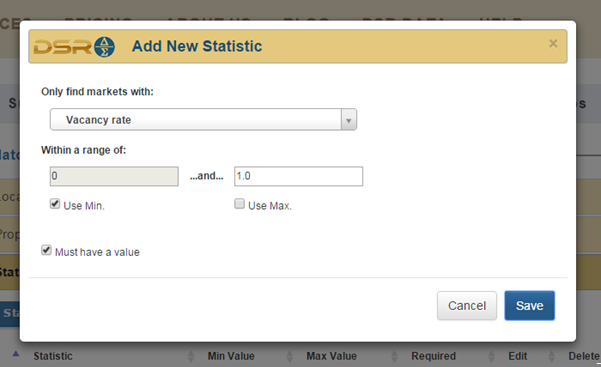
Let's add vacancy rate to the criteria. Click on the 'Add Statistic' button. From the pop-up pick Vacancy rate from the drop down list at the top.
Clear the 'Use Max' check box and set the maximum allowed vacancy rate to 1.0 and then click save.
Now re-run the search by clicking on the 'Show Matching Markets' button again.
You'll see that last filter we applied reduced the list from 23 matches to only 6. We now have a short-list to start our fundamental research on.
An important statistic to include in your search criteria is the Statistical Reliability (SR). Both the SR and the SR+. gauge the reliability of the data.
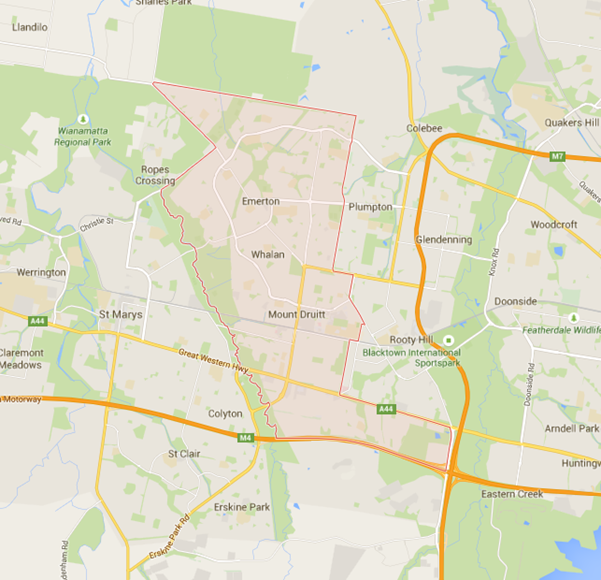
The post code 2770 appears frequently. Click on the link to see where this is on Google maps.
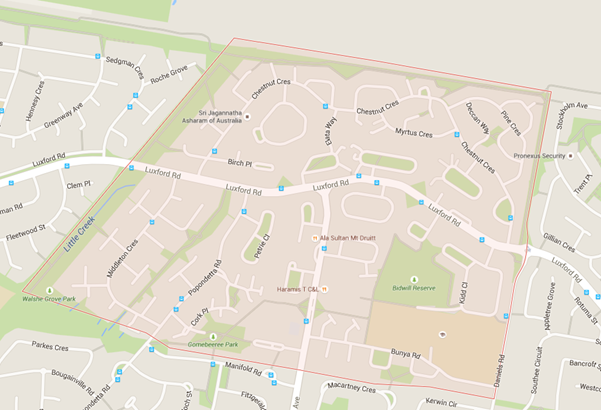
You can also click on the suburb name. Following is Google maps for Bidwill.
Many Sydney-siders will know that Mt Druitt is a lower socio-economic demographic. Domestic violence, unemployment and petty crime have been higher in this area than in most of the rest of Sydney.
But perhaps the stigma is fading. Certainly demand exceeds supply in this market. And it's not just one isolated suburb - the whole post code looks pretty good. Remember that as investors we're not going to live there - we're just going to invest there. It all comes down to supply and demand.
If you are worried about these type of areas make sure you:
- Hire the best property manager in the area, one with the most experience
- Ask for a lower rent than possible to get a broader number of applicants
- Choose an applicant with the longest and best rental history
Next steps
At this point you would use the Suburb Analyser and examine each of the key statistics in detail. How to do that is explained in the tutorial you've probably already seen for the Suburb Analyser...
how-to-quickly- gauge-a-suburbs-investment-potential
Alternatively, you may find the short-list inappropriate for your requirements. But you can change the statistics to suit your strategy fairly easily. In fact, some privileged members can search for the best property markets in the country by strategy using the Strategy Suitability Indexes. You can read all about them here...