Day on market
What is the DOM?
The DOM or Days on Market, is a count of the number of days a property will typically spend
advertised for sale before eventually selling.
A property is considered on the market as soon as the real estate agent lists the property for sale.
They will usually do this by advertising on one of the property search portals like
www.realestate.com.au.
Once the property has sold, the agent will remove the listing from the property search website. That time of advertising represents the DOM.
Why is the DOM important?
You can imagine that in a hot market, properties are snapped up quickly by eager buyers.
Perhaps buyers have been waiting for a property to come on the market. Clearly, the seller
is able to get the price they want without waiting too long for a buyer to come along or wasting
too much time negotiating. So a low DOM figure is a sign that demand is exceeding supply.
Conversely, if there is no buyer interest in a particular suburb,
properties will sit on the market for a long time. Even with strong buyer interest,
if there are too many properties for sale,
it will take a long time for all of them to sell. That means the DOM figure will be high.
So the DOM is a gauge of demand relative to supply. Since supply and demand are the only things
affecting property prices,
you can see that the DOM is a very important statistic.
A low DOM means there is pressure on prices to go up to re-balance the demand to supply ratio of the market.
The lower the DOM,
the more potential there is for immediate capital growth.
How can investors use the DOM?
Checking the DOM should be one of the first things you research as part of your due diligence.
Given how quick and easy it is you really have no excuse not to.
You can use the Suburb Analyser to check a property market's DOM.
You can also search for markets that have a low DOM using the Market Matcher.
The DOM is used in the basic DSR along with other stats. Checking the DSR is an easy way to view
a bunch of stats at a glance.
The DSR in turn is considered in DSR+ which is even more reliable since it
includes even more stats.
Is the DOM reliable?
It's quite possible the agent is a little tardy in removing the property
from the website once it has sold. It's also possible that properties are sold without
even listing. And a property may be listed for some time with one agent and then the seller decides
to use a different agent and so the property is delisted and relisted. Also, a sale may fall through resulting in
the relisting of a property.
These circumstances can muck with the figures a bit. But they are generally infrequent and can sometimes balance each
other out anyway.
It's worthwhile checking historical figures in case this stat has volatility
or quiet months. You can easily do this by clicking on the historical chart button in
the
Suburb Analyser
Clicking on the Historical Chart button will show you the history of the statistic for your market
of interest over the last few years. An example follows.
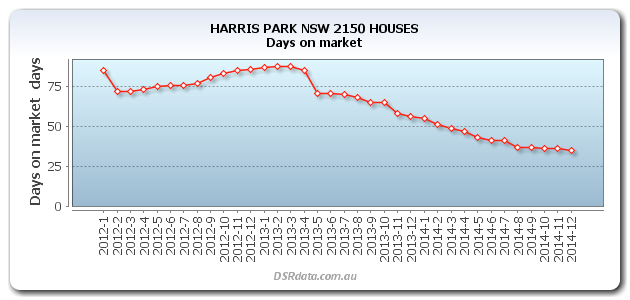
This example shows that for Harris Park houses, demand was rising with respect to supply because the DOM had been falling since early 2013.
What is a good DOM?
The following context ruler shows the DOM for Harris Park houses for December 2014 was 35 days. The chart also shows a range of possible, likely and typical DOM values.
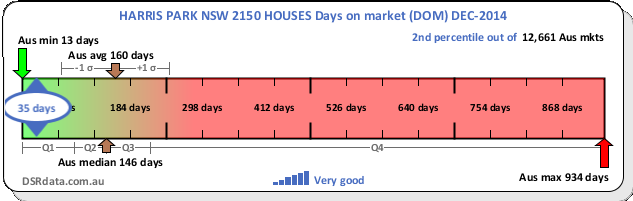
As you can see from the Context Ruler, a DOM of around 150 days was pretty normal in December 2014 around Australia.
Note that in some locations it takes longer to sell than in others - regardless of the state of the market. For example,
it is a big decision spending a few million dollars on a property. Few buyers in markets this expensive will rush in.
So the ritzy suburbs generally have higher DOM figures than cheaper locations.
You can find the best markets by DOM using the Market Matcher.
Base data sources
Some alternative sources for this kind of data include: