Discount
What is the discount?
The vendor discount (shortened to just discount) is the
difference between the
original asking price of a property for sale and the eventual
sale price. For example,
if a vendor has their property listed for sale at $400,000 and then the buyer
eventually pays $380,000 for the property, then the vendor discount was $20,000.
The discount is usually expressed as a percentage of the original asking price.
Using the example above the vendor discount would be 5%.
That is, $20,000 divided by $400,000 equals 5%.
This example is for only one property sale. If all property sales in a suburb were monitored, we could get
an average figure for the vendor discount.
Why is the discount important?
The discount represents how negotiable sellers have been on price. If a seller is struggling
to get a willing buyer for their property, they'll often consider a lower
sale price.
A lower sale price may make the property attractive enough to get
a buyer across the line.
When demand for property in an area is high and supply is low, the
vendors don't need to
discount much because they have something buyers want.
On the other hand, in a cool market vendors will need to lower their expectations.
So the vendor discount reflects the demand to supply in a property market. Since supply and demand are the only things
affecting property prices, you can see that the vendor discount is a very important statistic.
How can investors use the discount?
Checking the discount should be one of the first things you research as part of your due diligence.
Given how quick and easy it is you really have no excuse not to.
You can use the Suburb Analyser to check a property market discount.
You can also search for markets that have a low
using the Market Matcher.
The discount is used in the basic DSR along with other stats.
Checking the DSR is an easy way to view a bunch of stats at a glance.
The DSR in turn is considered in DSR+ which is even more reliable since it includes even more stats.
Is the discount reliable?
There are cases in which the discount may appear higher than what it really is.
Some real estate agents will entice buyers to sell through them by suggesting a sale price higher than what is realistic.
As buyers show a lack of interest, the agent will then condition the seller to lower their price to get a sale.
These markets are usually thinly traded where there is not much stock to sell and a lot of competition among realtors.
There may also be cases where the discount is lower than what is reasonable. A seller may change agents after
learning a great deal more about the likely price they are to receive. So they start off again, this time with
a much more realistic starting price.
A thinly traded market may not give the most accurate indication of typical
vendor discounting. A market with more than half a dozen sales per month is likely to have a
reliable vendor discount.
It 's worthwhile checking historical figures in case this stat has volatility or quiet months.
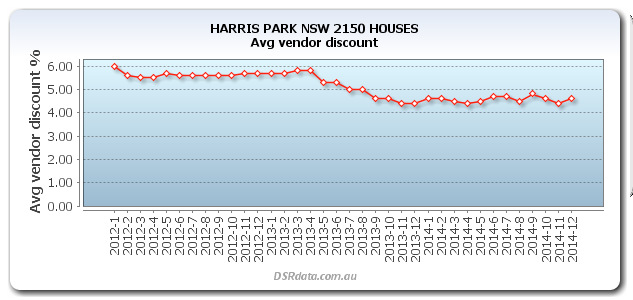
You can easily do this by clicking on the historical chart button in
the Suburb Analyser.
Clicking on the Historical Chart button will show you the history of the statistic for your market of
interest over the last few years. An example follows.

What is a good discount?
The following context ruler shows the Discount for Harris Park
houses for December 2014 was 4.6%.
The chart also shows a range of possible, likely and typical discount values.

As you can see from the Context Ruler, a discount of around 7.5% was pretty normal in December 2014 around
Australia.
You can find the best markets by discount using
the Market Matcher.
Base data sources
Some alternative sources for this kind of data include: