Statistcal Reliability +
What is the SR+?
The SR in SR+ stands for Statistical Reliability. The SR+ is a score out of 100 for the statistical reliability of the DSR+. The higher the SR+, the more reliable the data that was used to score the property market with a DSR+ figure.
Why is the SR+ important?
Data is not always available for every property market. There is almost always some data. But rarely is there ever a complete list of stats with no omissions.
You may see a high DSR+ for a market and jump into further research only to find that a number of the stats were not all that accurate. The SR+ can save you the trouble. If data is insufficient, the SR+ will be low. In these cases, you may prefer look elsewhere. Other investors might like to delve deeper hoping the market is an uncut gem.
Although the DSR data website shows a lot of stats, these are just the end product of a lot more data munging behind the scenes. For example, the vacancy rate calculations use about a dozen different figures from a number of different data sources. A lot of data is acquired to calculate just one statistic.
Is the SR+ reliable?
There are up to 9 different aspects of reliability considered in the calculation of the SR+. Some examples include:
- Volume
- Volatility
- Supporting stats
- Currency
- Etc
The calculations involved in determining an SR+ are usually more complicated than the calculations to determine the statistics themselves.
What is a good SR+?
The following context ruler shows the SR+ for Hawthorn houses in January 2015. The chart also shows a range of possible, likely and typical SR+ values.
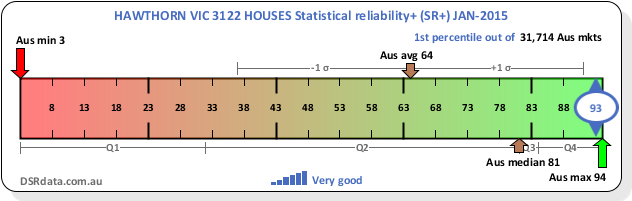
As you can see from the context ruler above, there is a wide range of typical SR+ values. Anything above 70 looks pretty reliable.
The closer to the green end of the ruler, the better. The benchmark or passmark is around the brown-olive colour in the ruler. This is usually about a score of 50.
Note that a score of 50 might not appear in the middle of the ruler depending on how the range of values have been scaled along the length of the ruler.
Please note that in April 2016 a change was made to how the SR+ is calculated. See the following link for details: Statistical Reliability - Publish everything?.