Renters
What is the proportion of renters?
The proportion of renters is often shortened to just renters. It is the
percentage of tenants living in a market compared to all dwellers in that market.
Of all the people that dwell in a suburb, we can try to categorise them into two groups: those who are
renting the home they live in and those who own the home they live in.
So if the suburb has a population of 1,000 and 600 people are owner-occupiers while 400 are tenants,
the proportion of renters would be 40%.
Why is the Renter proportion important?
In general, owner-occupiers take better care of their properties than tenants do. Why
would a tenant go to any trouble repairing or maintaining a property when that is the landlord's
responsibility? And why would a landlord spend a large amount of money adding value to a property that is just
a rental.
Owner-occupiers are more likely to take greater pride in the appearance of their property.
They are therefore more likely to improve the value beyond what makes pure commercial sense.
This affinity for over-capitalisation raises the general quality of housing in an area dominated
by owner-occupiers.
But that's not all.
Since it takes more money to own than to rent,
owners are generally in a higher socio-economic class than renters.
Although we all look at the housing in a suburb, it is really the people
that make a suburb what it is.
This all means that suburbs with a lower proportion of renters
will generally be more attractive than suburbs with a higher proportion of renters.
But there's yet another angle to look at: with a low proportion of rental properties,
there's less competition if you plan on providing rental accommodation there.
In other words, the lower the proportion of renters, the lower the vacancy rate is likely to be.
The renter proportion can be considered a current supply indicator. Remember that
prices rise when demand exceeds supply.
So to get good capital growth, we need the supply to be limited.
How can investors use the renter proportion?
Checking the renters score should be one of the first things you research
as part of your due diligence. You can use the
Suburb Analyser to check a property market's proportion of renters.
You can also search for markets that have a low proportion of renters using
the Market Matcher.
The Renters is used in the basic
DSR along with other stats.
Checking the DSR is an easy way to view a bunch of stats at a glance.
The DSR in turn is considered in DSR+ which is even more
reliable since it includes even more stats.
Is the proportion of renters reliable?
The base data comes from the ABS. They do a pretty good job in terms of reliable data.
However, they in turn source the data from what the Australian public fill in on census night.
The questions to do with tenancy type in the census may not be clearly understood by some.
Although the census data is very accurate at the time of sampling, the sampling frequency of once
every 5 years is virtually useless to investors 4 years later.
There's a rough check you can make to see if you're proportion of renters
figure is up to date. Jump onto one of the real estate portals like www.realestate.com.au
and check the number of properties available for rent. Also check the number available for sale.
Divide the number for rent by the number available for sale. As a percentage this number should
roughly match that of the proportion of renters. If the figure is radically different, then the one from the
ABS may be well out of date.
Remember that a census is conducted once every 5 years (2006, 2011, 2016, etc).
Another problem with the figure is how it is calculated. The ABS doesn't publish
a proportion of renters figure. They publish about 8 or 9 different categories.
In some markets there may be a significant number of residents that don't
neatly fit into one of the two categories: renter, owner occupier. In these cases
the proportion of renters may become inaccurate.
What is a good proportion of renters?
The following context ruler shows the proportion of renters for Morphetts Flat houses. The chart also shows a range of possible, likely and typical values for the proportion of renters.
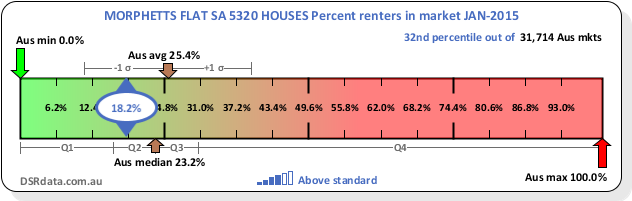
As you can see from the Context Ruler, a proportion of renters of around 24% was pretty normal in January 2015 around Australia.
You can find the best markets by Proportion of renters using the Market Matcher.
Base data sources
Some alternative sources for this kind of data include: