How to keep an eye on suburbs using alerts - Market Monitor
Intro
The Market Monitor allows you to set up alerts to keep an eye on a property market of interest over coming months. But why would anyone want to do that?
- Know when to buy
- You may have found some infrastructure project or other event you believe will push up prices in a location. But the impact of those projects has not taken effect yet. You don't want to enter the market too soon. You want to confirm that those projects definitely will affect prices. So you wait to see the 1st signs of movement in demand to supply ratio or price rise.
- Know when to refinance
- You may have no intention of selling. Perhaps it's a family investment to pass on to your heirs. But there are times when you should lock in equity gains so you have those funds to draw on in emergencies or for the next investment. If the demand to supply ratio looks like it is falling to a balanced position, prices may have climbed to their peak for this growth phase. So now is a good time for a loan top-up and perhaps buy again elsewhere.
- Know when to sell
- If the DSR has fallen to balanced levels there'll be little pressure on prices. If the DSR has fallen to dangerous levels, you might experience negative growth. So in either case you may want to consider selling especially if your plan was to capitalise on the growth phase. See this article (When to Sell) for an in-depth discussion...
- Know when to extend the lease or raise the rent
- If vacancy rates are climbing, it might be a good idea to ask the tenant to extend the lease early and perhaps for a discount if vacancy rates are in real trouble.
- If however vacancy rates are tight and yield is improving, perhaps it's time to ask your property manager if a rent increase is possible.
- Just curious
- You may have had a bet with a friend about a market you picked
- You may want to paper trade for a while before throwing your cold hard cash at an investment
- An industry professional may have suggested a property market and you want to keep track of it to see how they're recommendation is performing
How to monitor for the time to buy
I personally think that the best time to buy is when I have the financial means to do so (equity and serviceability). And at the time I look for the market with the highest DSR+ that suits my budget.
However, many investors research public infrastructure projects like train line extensions; or some major event like the Commonwealth games; or a large private enterprise operation like a new shopping centre or mine. Perhaps they look for emerging caf� cultures or changes in council zoning.
Whatever the research is based on, there is usually a statistic that will indicate when the nature of supply and demand is changing. And there is no better indicator than the DSR (well apart from the DSR+ of course).
A quick look at a DSR context ruler will highlight the DSR values of exceptional markets and those in balance.
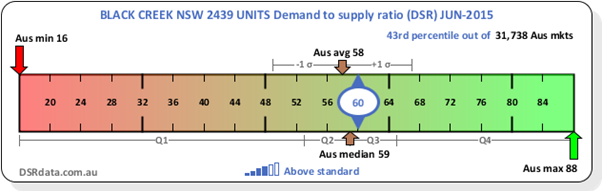
This context ruler shows that in Jun 2015 the DSR for the typical property market in Australia was in the high 50's. But it also shows that the overwhelming majority of suburbs had a DSR of less than 70.
In fact, 50% of all markets had a DSR between 53 and 65. That's seen on the thin grey line under the ruler between Q2 and Q3. These refer to Quartile 2 and Quartile 3. These are markets in the 25-75% range when ordered by DSR.
As investors we want exceptional property markets to invest in. So I wouldn't bother with a market that has a DSR less than 70. If I were keeping my eye on the right time to buy, I'd be waiting for the DSR to rise above 70.
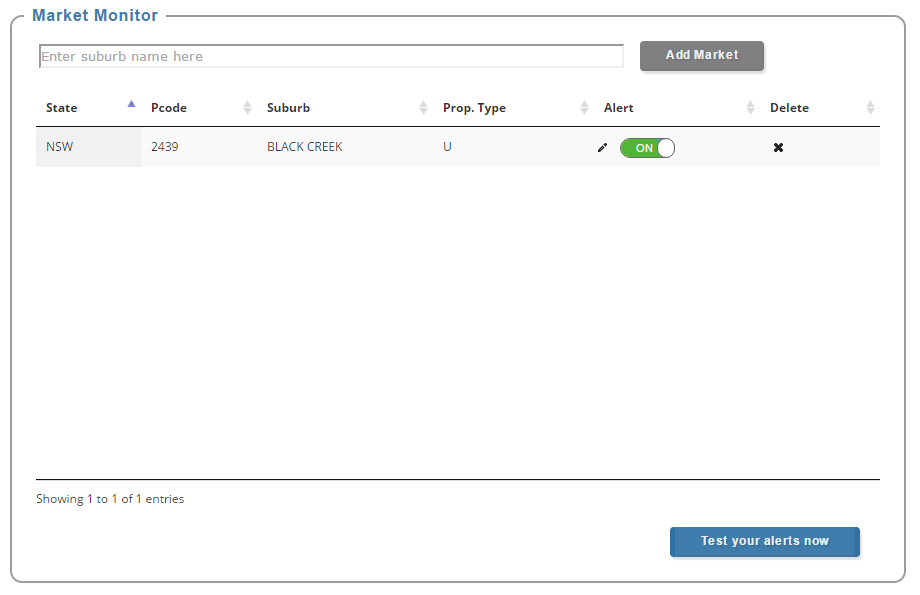
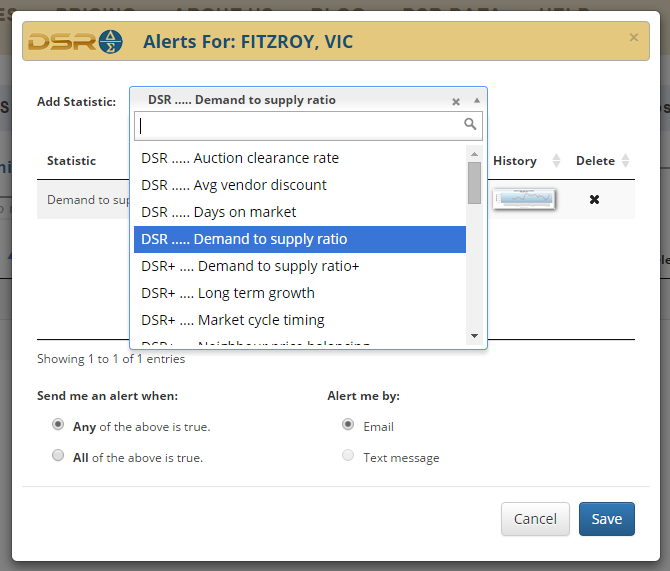
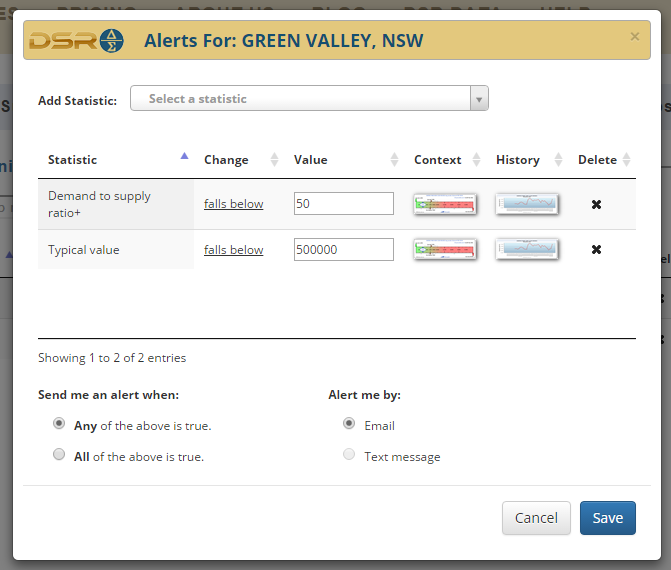
So how about we set up an alert in the Market Monitor for units in Black Creek. Assuming we don't have any markets to monitor yet, the Market Monitor will look like this...
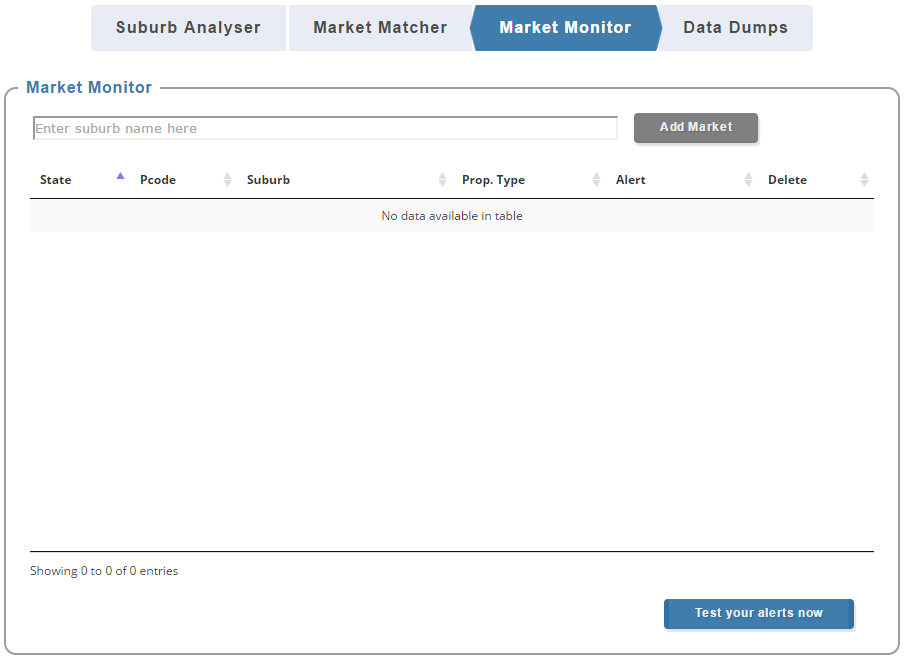
Select the market of interest by typing the suburb name in the field near the top. I selected units in Black Creek NSW post code 2439.
Then click on the 'Add Market' button. A pop-up should display like this:
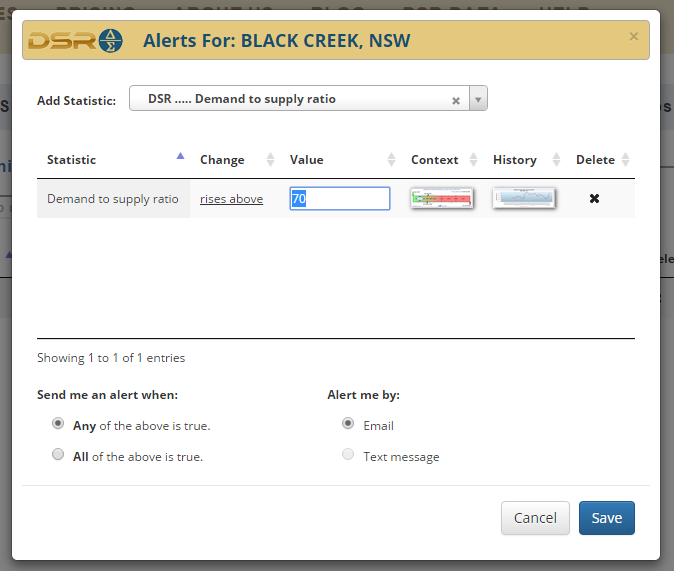
This pop-up will show all the statistics/indicators you're keeping an eye on for Black Creek. At the moment there are none.
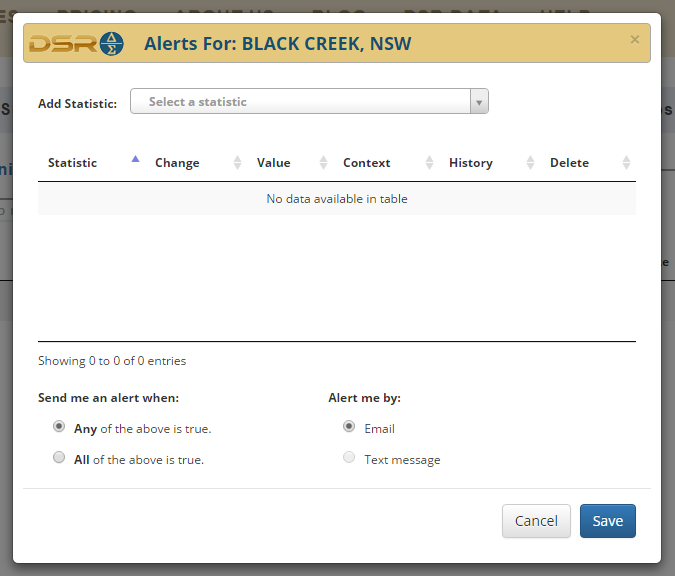
Let's assume we're watching this market waiting for some nearby infrastructure projects to start affecting supply and demand. So the 1st statistic we'll choose to watch is the DSR. If your membership gives you access, you should choose the DSR+ instead since it's more accurate.
So we select the DSR from the drop down list at the top of the pop-up. The statistic is shown in the table below with default settings.
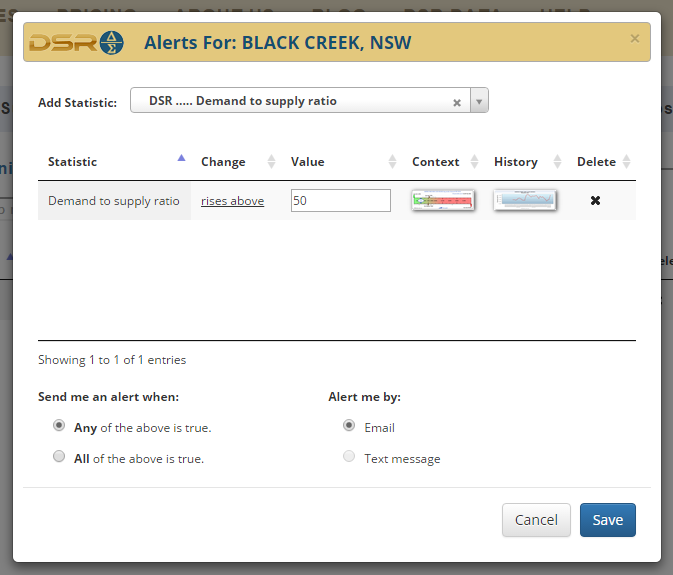
The alert for the DSR is defaulted to 'rises above' 50. A DSR of 50 is the theoretical balance point between supply and demand. We can change this default.
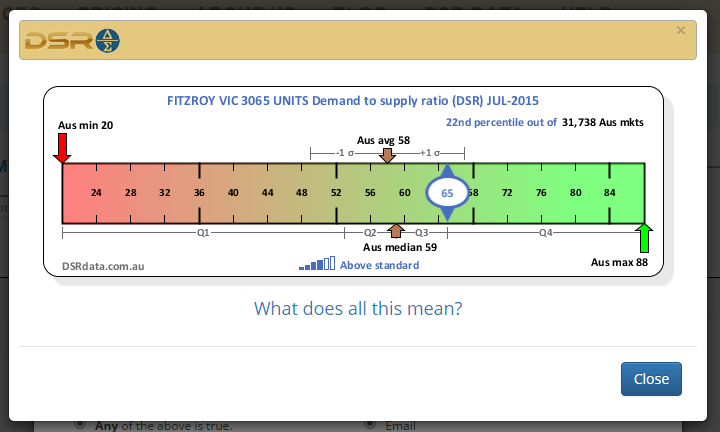
At the time of writing the DSR for units in Black Creek was 58. That was bang-onaverage for the country. You can see this figure in context by clicking on the 'Context ruler' button.
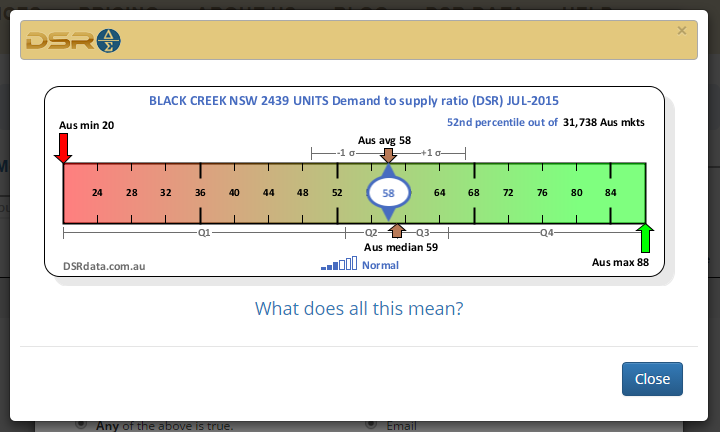
Let's wait till the DSR rises above 70 before making a move. So change the default value from 50 to 70.
Another statistic we might be interested in is the typical value. If prices start to rise significantly, we may want to jump in earlier. So select the Typical Value from the drop down list and set another "rises above" threshold value.
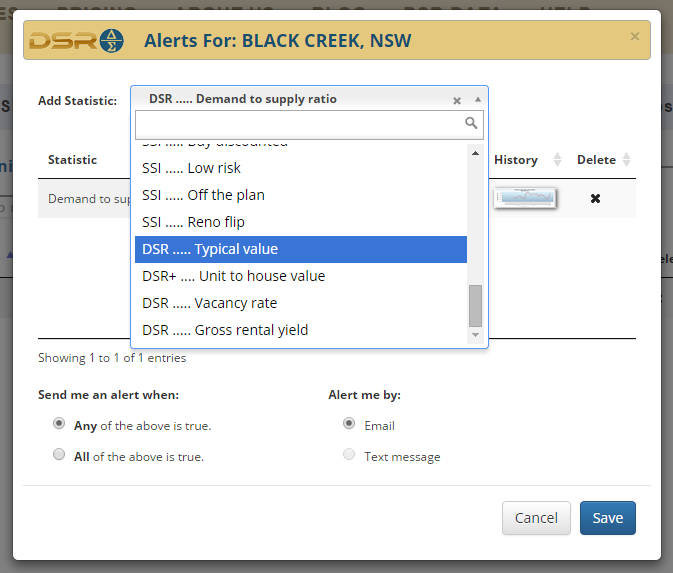
To pick a price as the trigger point, click on the Historical Chart button to the right of the Typical Value row.
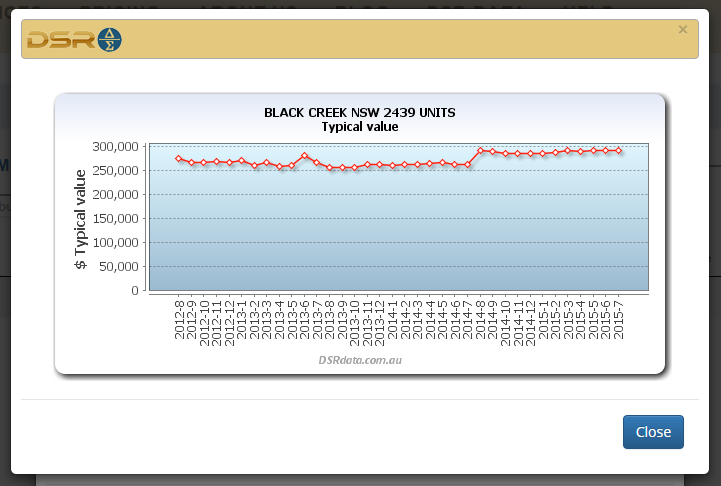
As you can see, prices have been fairly stable for the last year sitting just under $300,000. So let's set the trigger point to a typical value of $300k. If prices rise above this mark, something has changed.
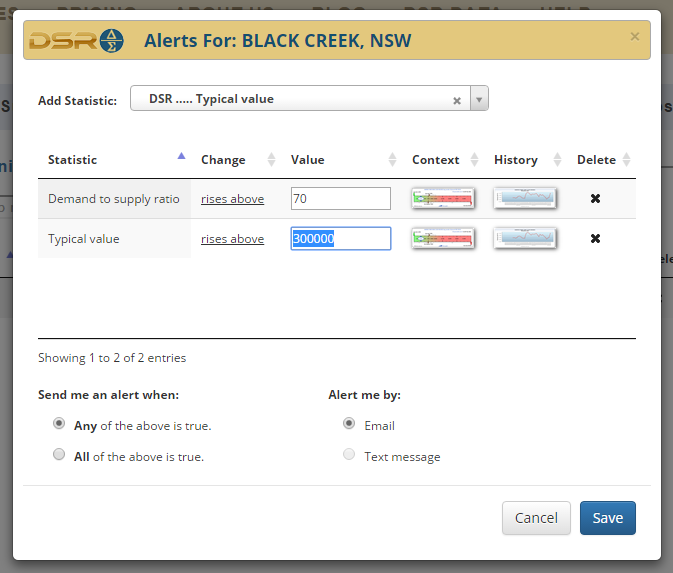
In markets with high volatility, prices can rise and fall by 10% per month pretty easily. So if Black Creek unit prices weren't so static, I'd pick a higher trigger point to allow for some movement each month.
Click on the blue 'Save' button to close the pop-up and return to the list of markets being monitored.
OK, let's test the alert. Click on the blue 'Test your alerts now' button towards the bottom right. You might see something like this...
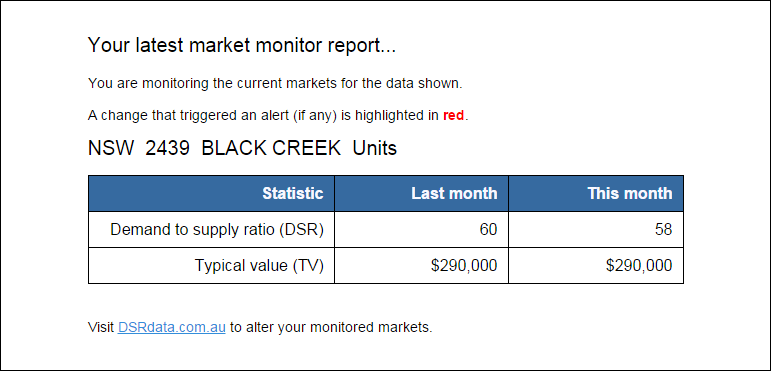
Since the DSR has not risen above 70, it is shown in black. And since the Typical Value has not risen above $300,000 it is shown in black too. If the Typical Value rose above $300,000 we might see something like this...
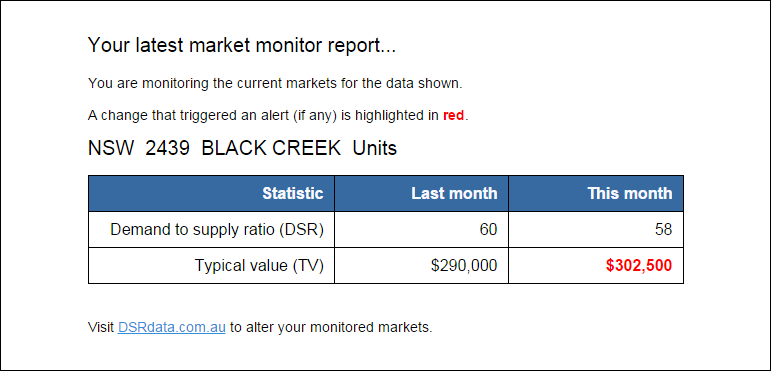
That makes it really easy to check the email you receive each month from the Market Monitor.
The statistics I usually set up alerts for include:
- DSR+
- Typical Value
- Vacancy rate
These 3 indicators tell me:
- The nature of supply and demand
- How that balance/imbalance is affecting prices
- Whether I should lock in a longer lease or look to raise the rent
How to monitor for time to sell
My most costly mistakes have been in regards to not selling. I've picked markets that have doubled in value in 3 years - and they weren't mining towns either. But they corrected and at even faster speed.
I held them because it was drummed into me when I was a noob investor to buy and never sell. If I had kept a close eye on those markets, I may have realised that there definitely is a time to sell. I was too focussed on the next hot spot and took my eye off those markets.
We can use the Market Monitor to notify us when trouble looms. The key indicators to monitor for most members include:
- DSR
- Typical Value (TV)
The key indicators to monitor if you are a privileged member include:
- DSR+
- Typical Value (TV)
The DSR+ is more accurate than the DSR, so if you can afford it, use that instead of the basic DSR. You can read up on all the indicators on this page:
There are two reasons an investor might want to sell that are related to changes in the nature of the market they have exposure to:
- End of a bull run
- Troubled times
Let's look at the indicators and settings for each.
End of a bull run
If we're looking to sell at the end of a bull run, we're trying to gauge the peak of the market. This is very easy to do in hindsight but much harder at the time. So the DSR becomes invaluable in this respect.
The ideal sell point is when price growth slows to a pace about in line with the national average. If you're looking for high growth, there's not much point holding property in a market with average growth, right?
This situation is best indicated when the DSR is in balance at a score around 50 or the national average. So we'd be looking for a score around 50 as a sell indicator usually. A quick look at a DSR context ruler will tell us what score is average at the moment.
You can see the average DSR for July 2015 was 58 and the median was 59. A less healthy national average DSR might be below 50.
Note that a DSR of 50 doesn't mean prices will start to fall. It simply means there is not enough pressure to push prices upwards at a faster than average rate. Prices may remain flat at DSR scores below 40.
Let's pick a hot market and set up the Market Monitor to notify us when it gets a little lacklustre.
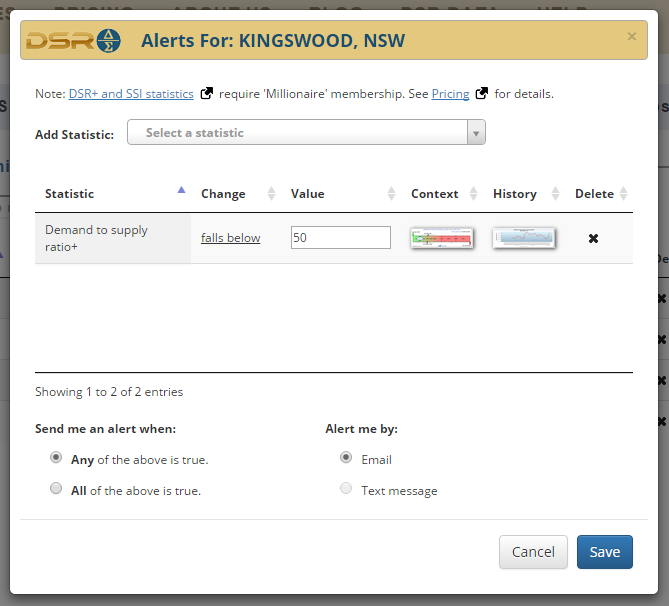
Add Fitzroy units to the Market Monitor and select the DSR from the drop down in the pop-up that appears.
Looking at the context ruler we can see that the DSR is above average.
We want to know when it falls below 60. So click on 'rises above' to toggle it to 'falls below'. Then enter 60 in the Value column. This means an alert is triggered when the DSR falls below 60 rather than the default which is rises above 50.
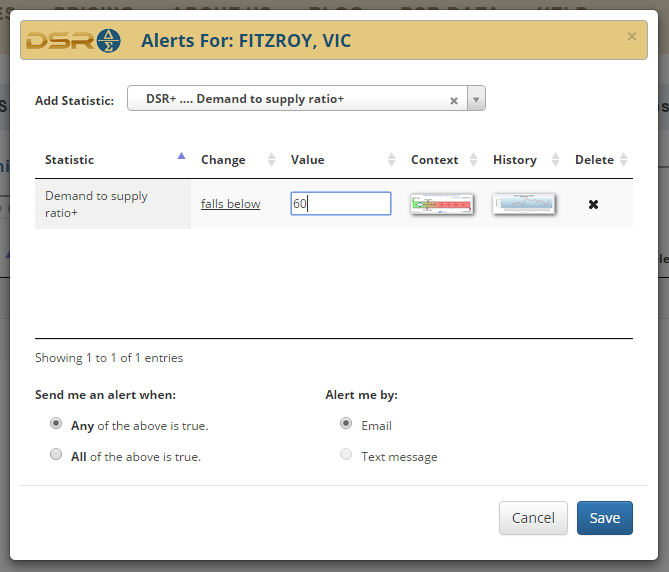
We might also be interested in watching the TV (that's Typical Value, not television). You can set a 'falls below' alert for the current TV so that if it drops, you'll see a RED notification in your alert email.
Troubled times
You may not be an aggressive bull-run hunting investor. You may be more of a set and forget investor. But there could come a time when the market is really depressed and it's time to take extreme action. There's no excuse for not keeping your eye on the market.
Checking for the end of a bull run is a little different to checking for a market in real trouble. I wouldn't show any serious concern if the DSR for a market fell to 50. However, if it starts falling further, like towards 40, you should look into what is going on and get the notion of selling as a possibility into your head.
The following graph shows the DSR for Moranbah houses from August 2012 to July 2015. Moranbah is a mining town in QLD.

For October to December the DSR was hovering above 50. No cause for alarm.
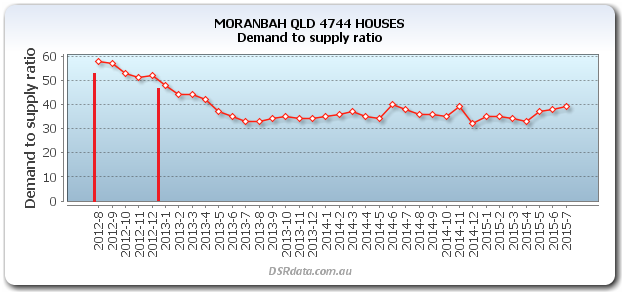
But then it dropped pretty quickly in December and January. Low 40s is definitely of concern. At this point I would've been doing some research to see what's going on.
The DSR dropped under 40 in May 2013.
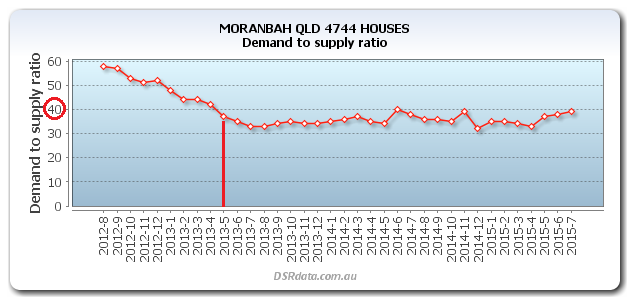
That's a sell trigger to me - especially for a regional mining town.
It may have taken a few months to get a contract signed so a sale date somewhere in July or August would have been possible. Have a look at what happened to prices...
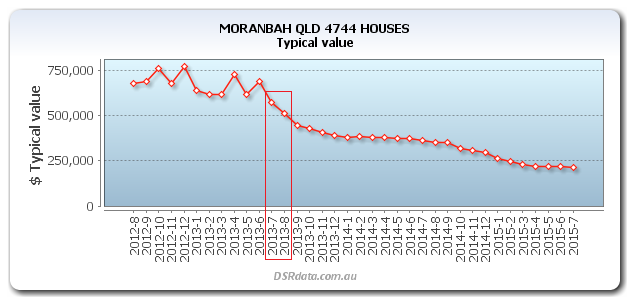
Although a bail-out in August was a bit late, most of the price landslide was avoided. If you managed to get out in August 2013 you may have got just over $500k. Two years later prices had dropped a staggering 50%. The DSR and the Market Monitor could've saved you $250,000!
But the DSR+ gave an even earlier sell indication. As I've mentioned before the DSR+ is a more accurate indicator of supply and demand.
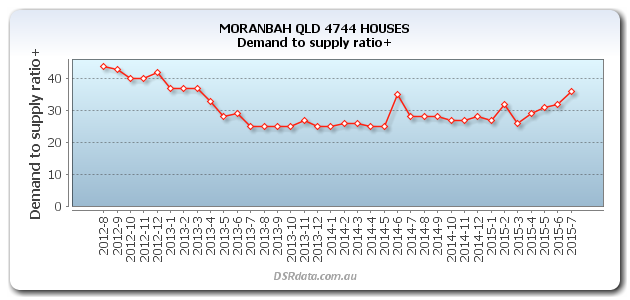
The DSR+ was already at 40 towards the end of 2012. It gave a clear sell indication in January 2013 when it dropped below 40. That means an investor may have been able to sell in April or May instead of August.
Getting out just a few months earlier would've saved you more than $100,000.
If the DSR+ drops below 40, it's definitely a trouble spot and you should seriously consider selling and quickly too. You don't know how much further prices will fall. Markets move very slowly. Whatever caused the problem is unlikely to go away soon.
Note that the DSR didn't fall any further from mid-2013. It was pretty much sideways business for 2 years.
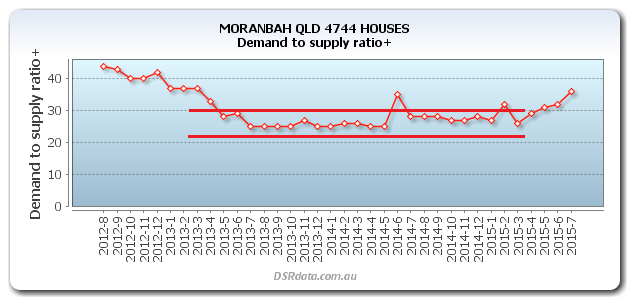
The DSR+ bounced around a bit mostly below 30. This is a score indicative of negative growth. And that's exactly what happened for that period.
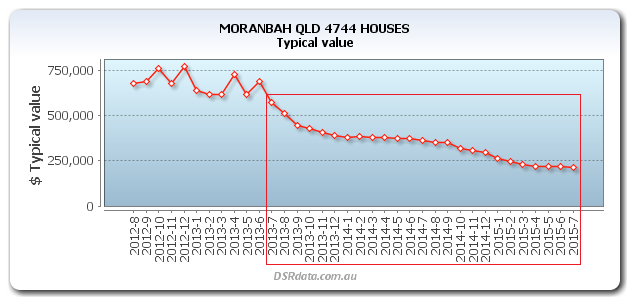
The point here is that prices can keep going lower while the DSR remains constantly low. Don't think that once the DSR has bottomed, prices will too. The DSR actually has to come back up closer to 40 before prices will stop falling. And then it probably has to climb above 50 before prices will start climbing.
Note: the DSR+ started rising in early 2015.
But it is still below 40. So price fall is only slowing.
If the DSR+ continues on the upward path, prices should stop falling. But they may not start climbing until the the DSR+ reaches around 50 or more. Remember, the 50 mark is the theoretical balance point between supply and demand.
You don't want to find out about a troubled market you're exposed to once it hits rock bottom and is on the evening news. You need to find out beforehand so you can offload while you still have a choice and some equity to salvage.
So I'd set a 'falls below 50' DSR+ alert in the Market Monitor for any property market I'm exposed to. And I'd set a 'falls below' for the TV too. I'd pick a price about 20% below current prices.
The Market Monitor is like insurance for your property portfolio's performance. It's a simple stop-loss to limit the impact of disasters. Given it's so quick to read each month and carries an almighty benefit, there's really no excuse not to use it.
If you know the suburbs some of your contacts have bought in, do them a favour and keep an eye on their markets too. It costs you less than a minute to forward your email alert on to them.
How to monitor for time to refinance
City markets are generally more stable than regional ones. This is because cities have tremendous economic diversity.
The advantage of investing in regional markets is that if you can pick the peaks and troughs, there's more profit potential. The disadvantage is the high risk associated with trying to pick these points.
The following image shows just how rapid prices can move in a regional market.
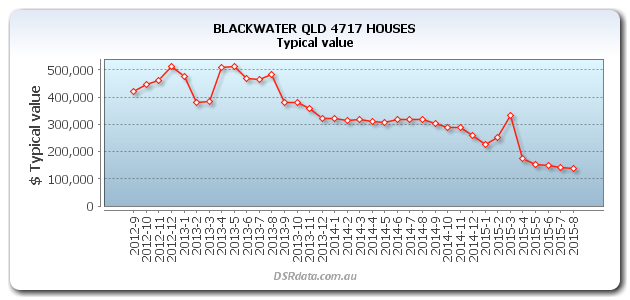
House prices in Blackwater QLD dropped by about 70% in 2 years. You won't see that sort of thing happen in any suburb of the major state capitals.
The disadvantage of investing in the cities on the other hand is that rapid capital growth can never match that of regional markets. But the advantage to cities is that you may never need to sell.
So why would you need to monitor a city market's prices if you never need to sell?
Well at some point you will need to refinance to draw on the increased equity that capital growth has given you. One of the best times to refinance for a loan top up is at the peak of the market, at the end of a price spurt.
So how do we pick the peak? And how can we use the Market Monitor to do it?
Prices rise when demand exceeds supply. But after a period of significant growth affordability creeps in subduing demand from buyers. Similarly, a couple of years of hot price growth can attract developers who will create extra supply.
So a balanced demand to supply ratio coming down from a high is a good indicator that price growth is about to stop. Since 50 is the theoretical balance point of supply and demand we can set a 'falls below' trigger for the DSR or DSR+ in the Market Monitor.
We can also examine the historical chart for changes in typical values. We can set a price point just below where prices are currently. If they fall below that value, we might suspect the end of a growth period. Of course, it may be just volatility, so we'd need to see a few months in a row of no growth or even negative growth.
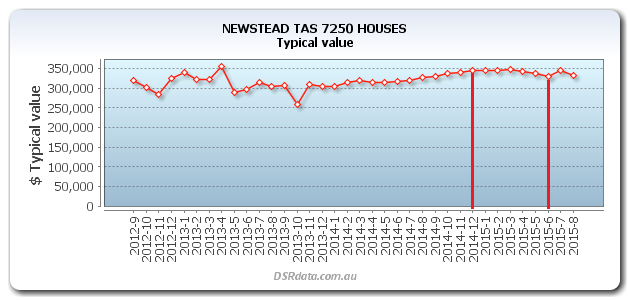
The chart above shows a clear slow down in price growth for houses in this Tasmanian suburb of Launceston. It happened at the end of 2014. There is even a slight dip in prices in the middle of 2015. This is a good indication that the small drivers of growth that affected this market for the last year have come to an end.
Combining a decreasing DSR and a levelling of price growth is a good indication market prices may have peaked. Now would be a good time to refinance to lock in the recent growth in case things sour. You don't want to be refinancing at the end of a price correction.
How to monitor for time to re-let
Most property investors are advised by their real estate agent of the state of the rental market towards the end of a lease. A good property manager will perform some analysis on the state of the rental market to ascertain if a rent increase is possible.
However, monitoring the vacancy rate of a market prior to lease renewal is a good idea.
Let's say that a flood of property has hit the market. And let's assume the majority of buyers have been investors. Soon there may not be enough tenants to go around. The way in which landlords fight over tenants is most often done by dropping asking rents.
You need to be proactive and know this is about to happen before it does. This may not be at the convenient time of the end of a lease. Your property manager is not obliged to inform you of changes in the state of the market even if they have noticed it.
If vacancy rates are rising 10 months prior to a lease renewal, 7 months from now may be too late to do something about it. There is no reason why you can't lock in a tenant for a long lease well in advance of the renewal date.
The best time to offer this to a tenant is before they find out what better options are available. This is before rents start dropping.
So of course we need to keep an eye on vacancy rates.
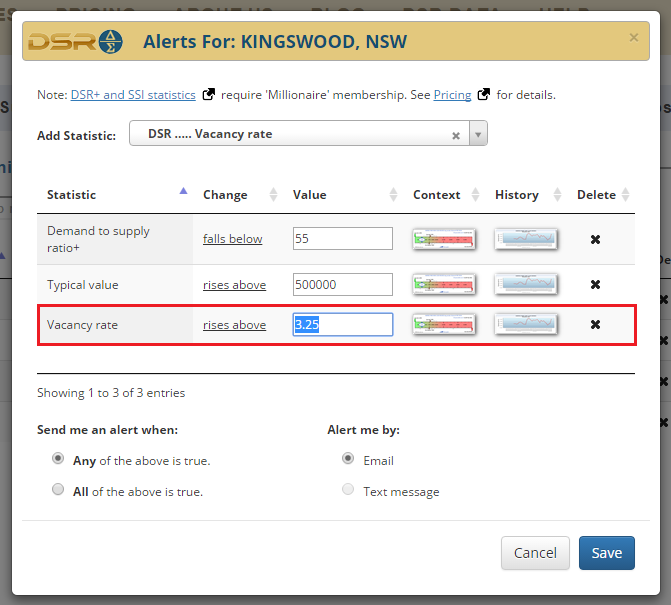
There is usually no cause for alarm if the vacancy rate rises above 3%. Rents might not start to be affected until vacancies reach 5% or even higher. But once vacancy does rise above about 3%, you should start doing some research to see if any knew rental stock is about to come on the market.
Knowing there is a pending oversupply of rental property allows you to offer your tenant a new lease that is attractive to them. What you're after is a long lease, 2 years minimum, at current rates.
If rents fall, your tenant will need to break the lease to leave. This offers some excellent security for a cunning landlord.